Market Commentary | March 23rd, 2026
Weekly Market Commentary
March 23rd, 2026
Iran War Update
The U.S./Israel conflict with Iran has continued to cause significant volatility within markets, and given this, we felt it was important to provide an additional update. Given the importance of the Middle East from an economic perspective, a prolonged conflict would pose significant economic damage to the global economy. Unfortunately, it appears that we are entering a heightened escalation phase, with reports of strikes on critical energy infrastructure and continued disruptions to shipping lanes, while the Strait of Hormuz remains mostly choked off.
While not a perfect measure of what is to come, prediction markets like Polymarket may offer a real-time snapshot of investment sentiment and collective expectations. As can be seen in the chart below, percentage odds of a durable ceasefire do not become likely before June, according to this system today.

Source: Polymarket (as of March 19, 2026)
Energy analysts broadly agree that sustained shipping disruptions or extensive damage to energy infrastructure would push energy prices, constrain discretionary demand, elevate input costs, and weigh on marginal growth. The global benchmark price for crude oil has risen to nearly $110 per barrel, nearly doubling since the start of the year. According to AAA, national gasoline prices have also risen from $2.82 at the start of the year to $3.91 as of March 19, 2026. The administration has attempted to counter some of these price increases with an announcement of 172 million barrels of oil to be released from the Strategic Petroleum Reserve (SPR) over the coming weeks and months. The market has largely looked through this announcement though, viewing the release as limited and insufficient to offset sustained supply disruptions. The U.S. (and other allies that have pledged releases) picture is complicated by the fact that the SPR was drawn down in the aftermath of the Russia-Ukraine war and has not been meaningfully rebuilt in the years since that conflict began.

Source: Bloomberg (as of February 28, 2026)
How this war affects the economy in the coming quarters is still coming into view, but rates markets are beginning to question the Federal Reserve’s ability to cut rates in this environment. In fact, markets are pricing in a 27% chance of an interest rate hike, a scenario that was assigned a 0% probability just one week ago.

We have felt for some time that additional rate cuts are justified, so seeing the likelihood of additional rate cuts fade gives us pause. With that said, recent reviews of real-time estimates of GDP growth are still solidly positive, and as we mentioned in our 2026 Market Outlook the global economy enjoys several tailwinds that should keep it from slipping into recession even if important commodity prices remain elevated.
We should also note that wartime conditions necessitate significant government spending to be sustained, which also automatically boosts GDP as well. This conflict is no different, as it is being reported that the White House is requesting an additional $200 billion in funding related to war with Iran.
With respect to markets, it is also important to note that the U.S. is a modest net energy exporter, largely due to shale oil and natural gas production, which provides some insulation from global energy shocks. In contrast, European and Asian countries are highly exposed to a Middle East energy shock. The chart below lays out these relationships, and countries more situated towards the top right are more exposed. Notably, large economies like Germany, Japan, and Taiwan are among the more exposed. Interestingly, China is far more insulated than other large Asian countries.

Equity markets have reacted to these realities accordingly, as U.S. equities have outperformed international stocks by nearly 5% since the start of the war. With that said, international equities still lead U.S. stocks for the year-to-date period through March 19. This highlights the importance of maintaining diversification and sticking with a long-term investment strategy. This is especially important in the face of difficult headlines and elevated market volatility.
While we have not recommended any large changes to allocations as a result of recent market movements, we are watching the increased levels of market pessimism among equity investors to see if there is an opportunity. Historically, periods of geopolitical uncertainty have often created short‑term valuation dislocations rather than long‑term earnings impairment. Therefore, price declines across the major indexes would represent lower valuations, a welcome change in our view as equities had become overpriced in many cases.
We share our asset class recommendations and notes below, which will have more detail on these items in our upcoming quarterly investment update report. As always, we hope this information is helpful, and please contact the Cambridge Due Diligence Team (duediligence@cir2.com) at 800-777-6080 for questions.
| Equities | Current Weighting | Outlook |
| U.S. Large Cap | Neutral | Excellent fundamental outlook and technical backdrop given large ongoing buybacks. High concentration of the largest names and high valuations keep us neutral on this asset class. We favor high quality, defensive investments and certain sectors like healthcare and financial stocks. |
| U.S. Mid and Small Cap | Neutral | Modest valuations and falling interest rates should provide a tailwind to investors here. We currently recommend a neutral weight but might look to change to overweight as the year progresses. |
| EAFE | Neutral | Japanese equities look interesting, and the currency diversification into Yen and Euros could still provide a tailwind. Weak European growth and worrisome trends in sovereign yields keep us neutral. |
| EM | Neutral | Some of the lowest equity market valuations available to investors. There are still economic risks in China that keep us neutral here, as it represents the largest country weight in the index. |
| Duration | Current Weighting | Outlook |
| Treasuries | Underweight | While rates are solidly positive across the yield curve, huge potential net new Treasury supply and continuing refinancing needs keep us modestly short duration relative to benchmark expressed primarily through a Treasury underweight. |
| IG Corporates | Underweight | Narrow spreads keep us underweight this segment despite our economic outlook. If spreads normalize we will look to upgrade our outlook. |
| Agency Mortgages | Overweight | Wide spreads relative to both Treasuries and high-quality corporate bonds make this our preferred way to obtain duration exposure. We expect technical buying pressure to continue into 2026 as institutional investors rebuild allocations here. |
| Munis | Neutral | Ratios of yields between AAA munis and Treasuries have normalized. There is also only modest amounts of spread to be gained by reducing the quality profile of a muni portfolio today. Term spreads, the difference between long and short-term municipal bonds, are solid, providing investors an opportunity barbell exposures to produce additional yield. |
| Credit | Current Weighting | Outlook |
| High Yield | Neutral | Fundamental changes to the index with respect to quality composition and duration, along with our economic outlook means we expect defaults to remain subdued. Relatively narrow spreads keep us from an overweight recommendation in this asset class. |
| Leveraged Loans | Underweight | Years of poor underwriting standards along with potential technical selling pressure from retail investors makes us maintain an underweight recommendation here despite our economic outlook. |
| Structured Credit | Overweight | Structured credit remains our favored way to gain credit exposure, as this segment offers solid yields with modest credit and duration risk. Our favorite segments within this asset class include Non-Agency RMBS and CMBS, as the collateral values for both are likely to rise in 2026, improving their respective credit quality. |
| Alternatives | Current Weighting | Outlook |
| Private Equity | Overweight | Reinvigorated capital markets should promote portfolio realizations and returns. Our economic outlook, combined with lower borrowing costs leads us to believe these asset classes should provide total return that outperforms public markets. Manager selection is key here. |
| Private Debt | Neutral | We have seen some concerning defaults in this arena, along with some concern around underwriting standards. However, we still think this asset class will deliver solid liquid returns even as there has been softness in broader bond markets. We expect the private debt market to continue to grow. Like private equity, manager selection is key. |
Week in Review
Over the course of the week, markets digested a variety of U.S. economic releases as well as the Federal Reserve meeting. Investors focused on the durability of economic growth amid persistent inflation risks.
The focal point of the week was the March Federal Open Market Committee (FOMC) meeting, where the Federal Reserve held the federal funds target range unchanged at 3.50%-3.75%. However, the tone of the meeting was more hawkish and both headline and core Personal Consumption Expenditure (PCE) inflation forecasts were raised to 2.7%. Fed Chair Jerome Powell acknowledged that inflation progress has been slower than expected among elevated uncertainty stemming from energy prices and geopolitical tensions.
The February Producer Price Index (PPI) rose 0.7% month-over-month, well above consensus expectations and accelerating from January’s 0.5% increase. For investors, this reinforced concerns that inflation pressures remain persistent at the wholesale level. Core inflation also remained firm, rising by 0.5% over the month. This is closely watched by policymakers as an indicator of more durable inflation pressures that may eventually pass through to consumer prices.
Manufacturing data showed renewed momentum. The Philadelphia Fed Manufacturing Index rose to 18.1, well above expectations. This gain was driven by a sharp rebound in shipments, with new orders easing but remaining positive. Forward-looking manufacturing expectations remain elevated, highlighting ongoing optimism even as cost pressures and global uncertainties increase.
Housing data provided mixed signals. Residential construction improved as housing starts rebounded, driven primarily by an increase in multifamily projects. On the other hand, single-family construction remained subdued due to ongoing affordability constraints and elevated mortgage rates. New home sales also fell sharply to an annualized pace of 587,000 units, the lowest level in more than three years. This slowdown reflects the continued strain on housing demand due to affordability challenges and volatile mortgage rates.
Labor market data showed signs of stabilization. Weekly initial jobless claims fell to 205,000, the lowest reading since January. This supports the view of a labor market characterized by limited hiring and limited layoffs. Continuing claims remain subdued, indicating that layoffs remain contained even as hiring momentum eases.
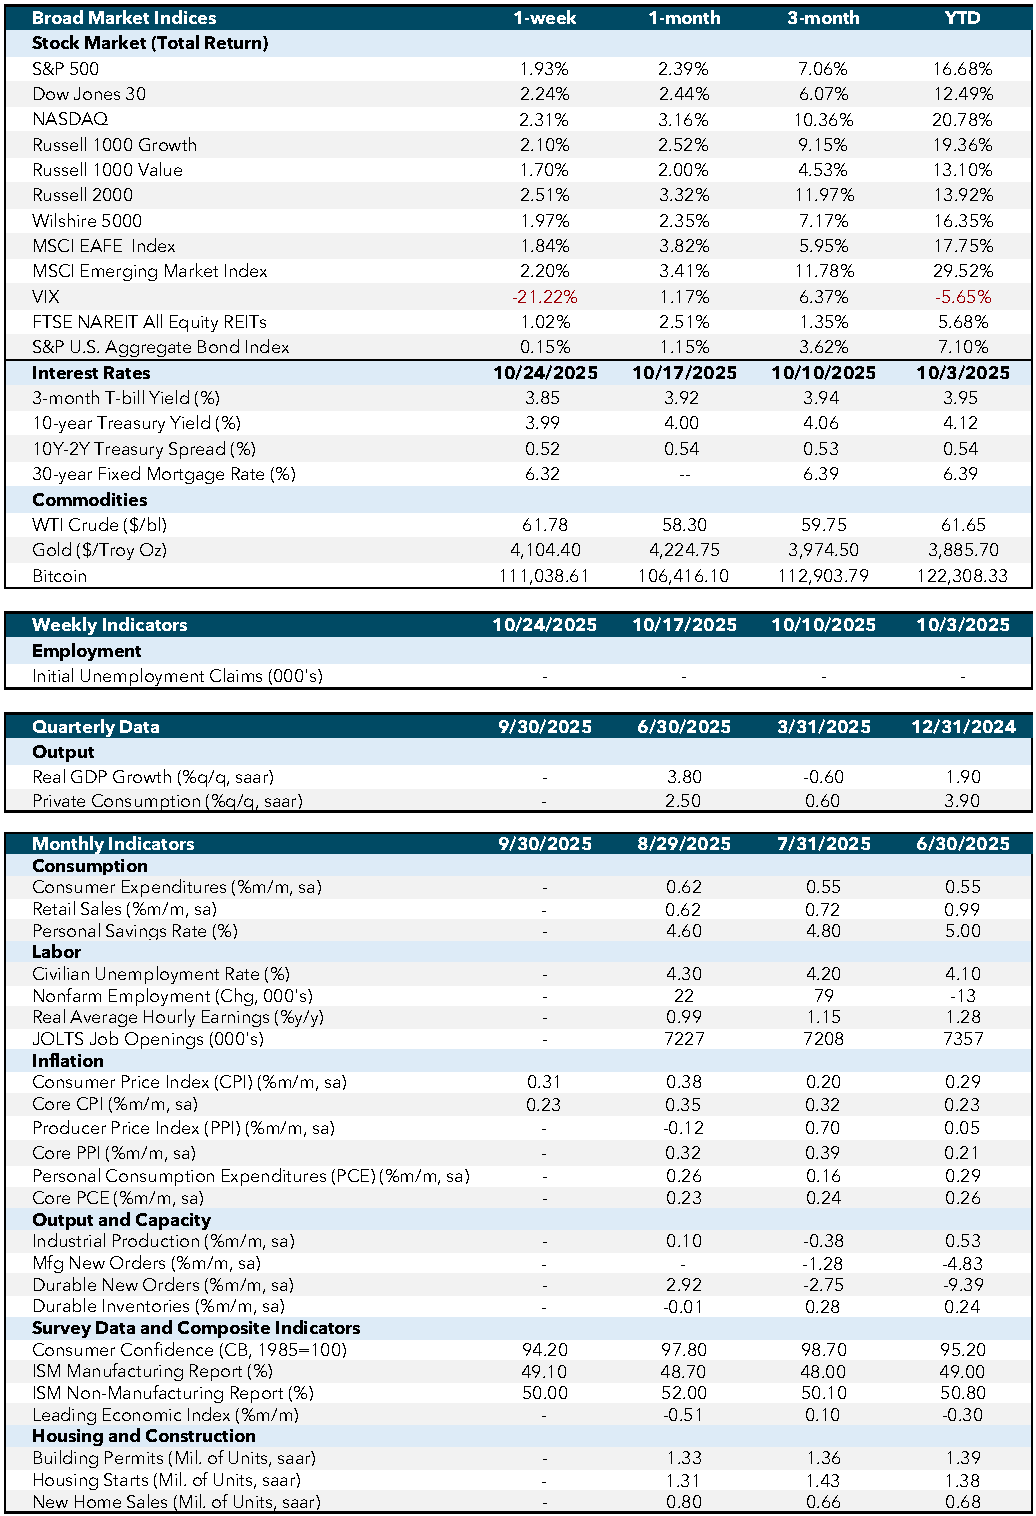
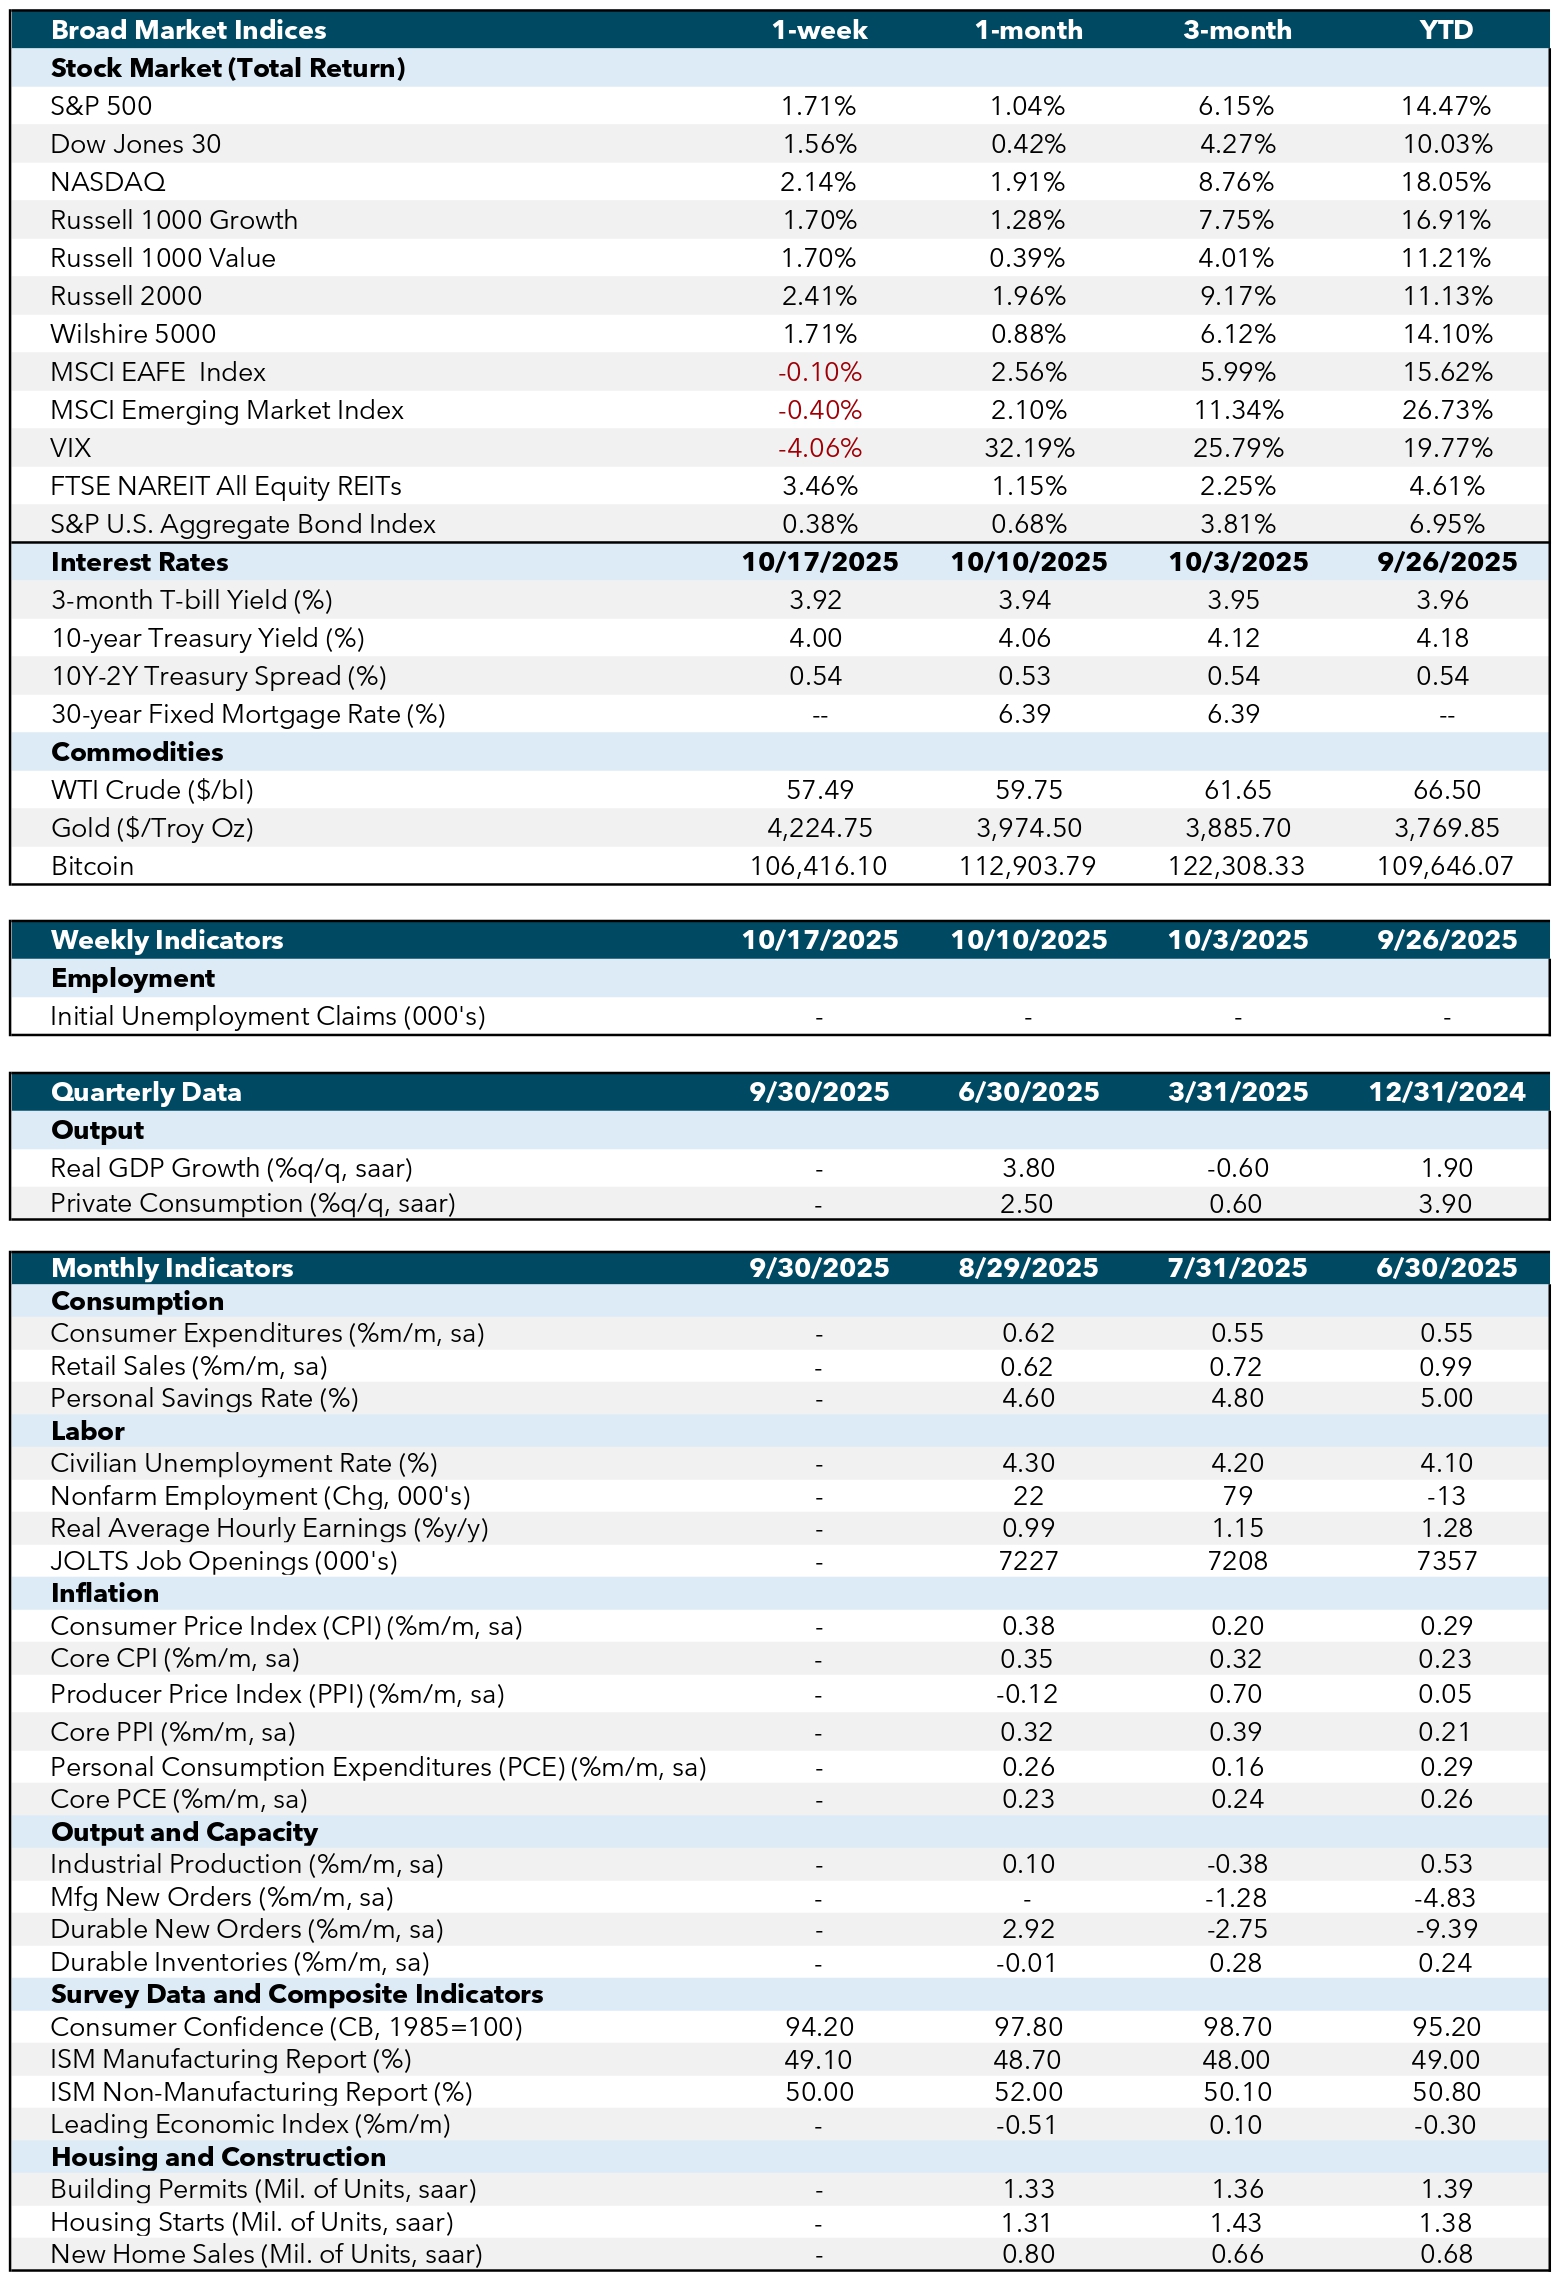
Economic and Capital Markets Dashboard

Week Ahead…

The upcoming week will include multiple economic releases that will refine investor expectations for growth, inflation, and Federal Reserve policy.
Tuesday will include the release of both the U.S. Manufacturing and Services Purchasing Managers’ Index (PMI), offering an early read on economic activity over March. The Manufacturing PMI will be watched for confirmation that strength in regional factory surveys is translating to the national level. The Services PMI will be monitored for signs that consumer demand remains intact despite elevated prices and borrowing costs.
On Wednesday, the February import and export price indexes will be watched for signals on pipeline inflation. Investors will be assessing the pass-through of higher energy costs, tariffs, and currency effects into domestic pricing. Firm readings could reinforce recent economic readings reflecting persistent cost pressures.
On Thursday, initial and continuing jobless claims will provide a signal on employment stability. Low claims could reinforce the view that layoffs remain contained, even as firms stay cautious about adding new workers.
The week will conclude with the University of Michigan Consumer Sentiment survey, including inflation expectations. This survey will be closely watched by investors and policymakers, as elevated expectations could support the Federal Reserve’s cautious, data-driven policy stance.
Economic Indicators:
- CPI: Consumer Price Index measures the average change in prices paid by consumers for goods and services over time. Source: Bureau of Labor Statistics.
- Core CPI: Core Consumer Price Index excludes food and energy prices to provide a clearer picture of long-term inflation trends. Source: Bureau of Labor Statistics.
- PPI: Producer Price Index measures the average change in selling prices received by domestic producers for their output. Source: Bureau of Labor Statistics.
- Core PPI: Core Producer Price Index excludes food and energy prices to provide a clearer picture of long-term inflation trends. Source: Bureau of Labor Statistics.
- PCE: Personal Consumption Expenditures measure the average change in prices paid by consumers for goods and services. Source: Bureau of Economic Analysis.
- Core PCE: Core Personal Consumption Expenditures exclude food and energy prices to provide a clearer picture of long-term inflation trends. Source: Bureau of Economic Analysis.
- Industrial Production: Measures the output of the industrial sector, including manufacturing, mining, and utilities. Source: Federal Reserve.
- Mfg New Orders: Measures the value of new orders placed with manufacturers for durable and non-durable goods. Source: Census Bureau.
- Durable New Orders: Measures the value of new orders placed with manufacturers of durable goods. Source: Census Bureau.
- Durable Inventories: Measures the value of inventories held by manufacturers for durable goods. Source: Census Bureau.
- Consumer Confidence (CB, 1985=100): Measures the degree of optimism that consumers feel about the overall state of the economy and their personal financial situation. Source: Conference Board.
- ISM Manufacturing Report: Measures the economic health of the manufacturing sector based on surveys of purchasing managers. Source: Institute for Supply Management.
- ISM Non-Manufacturing Report: Measures the economic health of the non-manufacturing sector based on surveys of purchasing managers. Source: Institute for Supply Management.
- Leading Economic Index: Measures overall economic activity and predicts future economic trends. Source: Conference Board.
- Building Permits (Mil. of Units, saar): Measures the number of new residential building permits issued. Source: Census Bureau.
- Housing Starts (Mil. of Units, saar): Measures the number of new residential construction projects that have begun. Source: Census Bureau.
- New Home Sales (Mil. of Units, saar): Measures the number of newly constructed homes sold. Source: Census Bureau.
- SA: Seasonally adjusted.
- SAAR: Seasonally adjusted annual rate.
Market Indices & Indicators:
- S&P 500: A market-capitalization-weighted index of 500 leading publicly traded companies in the U.S., widely regarded as one of the best gauges of large U.S. stocks and the stock market overall.
- Dow Jones 30: Also known as the Dow Jones Industrial Average, it tracks the share price performance of 30 large, publicly traded U.S. companies, serving as a barometer of the stock market and economy.
- NASDAQ: The world’s first electronic stock exchange, primarily listing technology giants and operating 29 markets globally.
- Russell 1000 Growth: Measures the performance of large-cap growth segment of the U.S. equity universe, including companies with higher price-to-book ratios and growth metrics.
- Russell 1000 Value: Measures the performance of large-cap value segment of the U.S. equity universe, including companies with lower price-to-book ratios and growth metrics.
- Russell 2000: A market index composed of 2,000 small-cap companies, widely used as a benchmark for small-cap mutual funds.
- Wilshire 5000: A market-capitalization-weighted index capturing the performance of all American stocks actively traded in the U.S., representing the broadest measure of the U.S. stock market.
- MSCI EAFE Index: An equity index capturing large and mid-cap representation across developed markets countries around the world, excluding the U.S. and Canada.
- MSCI Emerging Market Index: Captures large and mid-cap representation across emerging markets countries, covering approximately 85% of the free float-adjusted market capitalization in each country.
- VIX: The CBOE Volatility Index measures the market’s expectations for volatility over the coming 30 days, often referred to as the “fear gauge.”
- FTSE NAREIT All Equity REITs: Measures the performance of all publicly traded equity real estate investment trusts (REITs) listed in the U.S., excluding mortgage REITs.
- S&P U.S. Aggregate Bond Index: Represents the performance of the U.S. investment-grade bond market, including government, corporate, mortgage-backed, and asset-backed securities.
- 3-Month T-bill Yield (%): The yield on U.S. Treasury bills with a maturity of three months, reflecting short-term interest rates.
- 10-Year Treasury Yield (%): The yield on U.S. Treasury bonds with a maturity of ten years, reflecting long-term interest rates.
- 10Y-2Y Treasury Spread (%): The difference between the yields on 10-year and 2-year U.S. Treasury bonds, often used as an indicator of economic expectations.
- WTI Crude ($/bl): The price per barrel of West Texas Intermediate crude oil, a benchmark for U.S. oil prices.
- Gold ($/Troy Oz): The price per troy ounce of gold, a standard measure for gold prices.
- Bitcoin: A decentralized digital currency without a central bank or single administrator, which can be sent from user to user on the peer-to-peer bitcoin network.
This content was developed by Cambridge from sources believed to be reliable. This content is provided for informational purposes only and should not be construed or acted upon as individualized investment advice. It should not be considered a recommendation or solicitation. Information is subject to change. Any forward-looking statements are based on assumptions, may not materialize, and are subject to revision without notice. The information in this material is not intended as tax or legal advice.
Investing involves risk. Depending on the different types of investments there may be varying degrees of risk. Socially responsible investing does not guarantee any amount of success. Clients and prospective clients should be prepared to bear investment loss including loss of original principal. Indices mentioned are unmanaged and cannot be invested into directly. Past performance is not a guarantee of future results.
The Dow Jones Industrial Average (DJIA) is a price-weighted index composed of 30 widely traded blue-chip U.S. common stocks. The S&P 500 is a market-cap weighted index composed of the common stocks of 500 leading companies in leading industries of the U.S. economy. The NASDAQ Composite Index is a market-value weighted index of all common stocks listed on the NASDAQ stock exchange.
Securities offered through Cambridge Investment Research, Inc., a broker-dealer, member FINRA/SIPC, and investment advisory services offered through Cambridge Investment Research Advisors, Inc., a Registered Investment Adviser. Both are wholly-owned subsidiaries of Cambridge Investment Group, Inc. V.CIR.0326-1021