Market Commentary | October 27th, 2025

Market Commentary | October 27th, 2025

Weekly Market Commentary

October 27th, 2025

Week in Review…

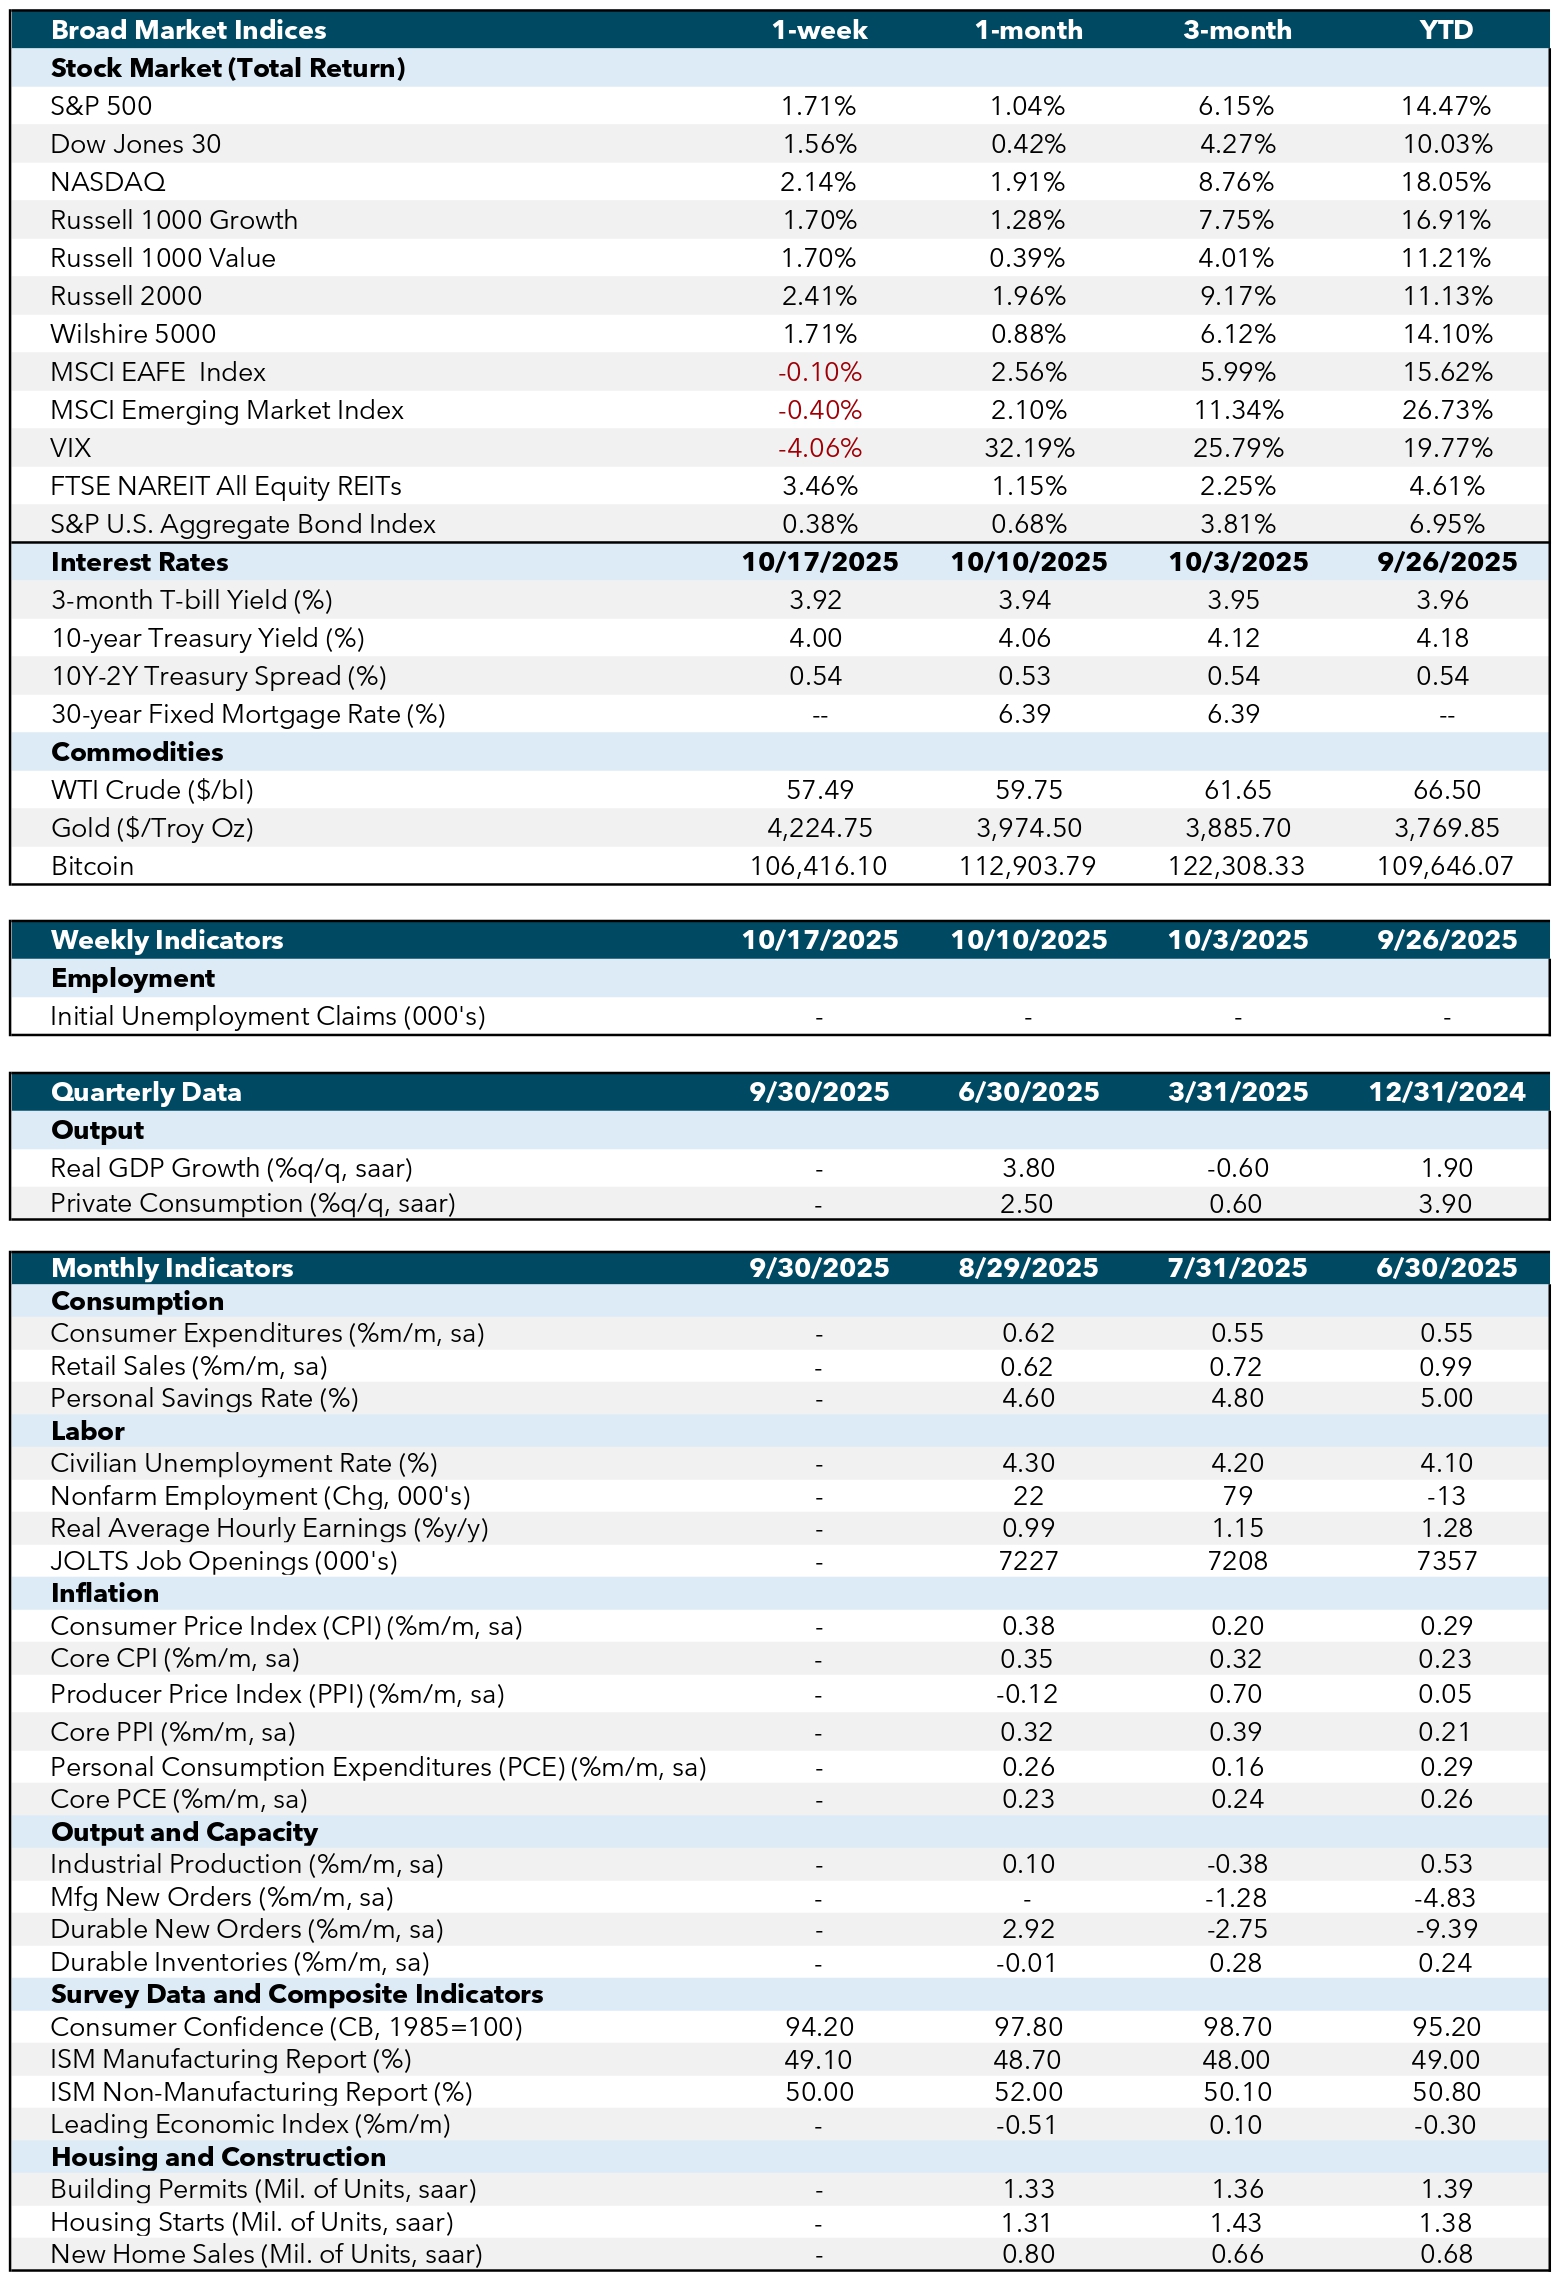
The most impactful release of the week was Friday’s Consumer Price Index (CPI) report. Both headline and core CPI came in slightly below expectations, with core CPI rising 0.2% versus 0.3% anticipated. Given the Fed’s preference for core inflation as a gauge of underlying price pressures, this softer print suggests inflation is sticky but trending lower, though still above the Fed’s target.

Another notable development was the 5-year Treasury Inflation-Protected Securities (TIPS) auction, which cleared at 1.182%, down from 1.650% in the prior auction. Interestingly, the 5-year breakeven inflation rate held near 2.42%, signaling markets expect lower real rates while inflation expectations remain anchored. The rationale is unclear — whether it reflects slowing growth, a flight to quality, or expectations of a lower Fed Funds rate as the Fed gravitates toward a lower neutral rate is yet to be determined. This dynamic likely explains why longer-dated yields, such as the 20-year Treasury auction, also came in below previous levels, reinforcing the notion that investors anticipate lower real rates despite static inflation expectations.

On the consumer side, the University of Michigan finalized October inflation expectations, showing 1-year expectations declining in line with forecasts, but 5-year expectations surprising to the upside at 3.9% versus 3.7% previously. This divergence suggests consumers anticipate higher inflation over the long run, even as near-term pressures ease.

Quick Hitters

  • Housing: September existing home sales rose 1.5% month-over-month, in line with expectations. This uptick hints at resilient demand and suggests structurally lower rates could unlock further housing activity.
  • Business Activity: Preliminary S&P Global Manufacturing and Services Purchasing Managers’ Indexes (PMIs) exceeded expectations and prior readings, signaling improving sentiment and underlying economic strength
  • Consumer Sentiment: In contrast, the University of Michigan consumer sentiment index softened, highlighting concerns about household confidence. Given consumption’s critical role in gross domestic product (GDP), markets will monitor this trend.

Economic and Capital Markets Dashboard

Week Ahead…

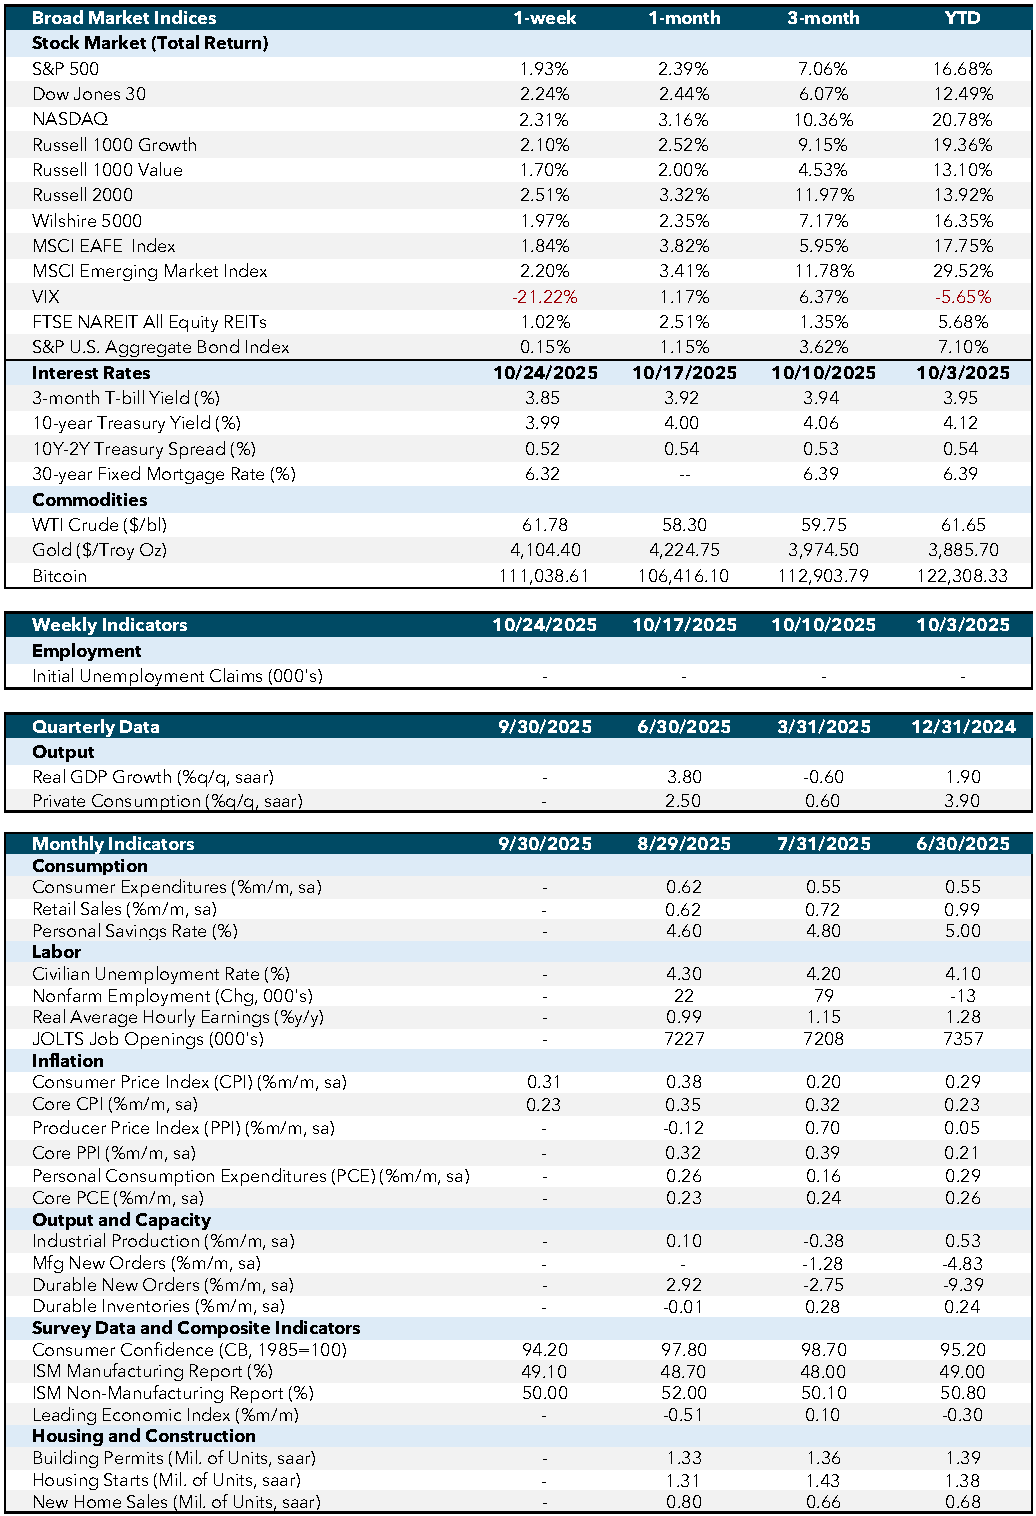
With inflation easing and markets nearly certain of a rate cut, attention now shifts to what comes next. The week ahead brings the Federal Open Market Committee (FOMC) meeting into sharp focus, alongside a handful of consumer and demand indicators that could shape expectations for growth and policy.

The upcoming FOMC meeting will dominate market attention. Last week’s softer CPI print reinforced a picture of easing inflation pressures, but the Fed faces a limited data backdrop, particularly on labor market conditions. With few fresh indicators, policymakers may lean on secondary sources to gauge economic momentum. Despite this uncertainty, markets remain confident in a 25 bps rate cut, with odds holding near 98%.

Beyond the Fed, this week’s economic calendar is light due to the government shutdown, but several releases will help gauge consumer and demand trends. On Tuesday, the Conference Board Consumer Confidence Index will measure household optimism — a key driver of spending and growth. On Wednesday, the pending home sales report offers a forward-looking view of housing demand, signaling whether lower rates are unlocking buyer activity. Additionally, the weekly crude oil inventory report may draw more attention than usual. Last week broke a three-week streak of weaker-than-expected demand, and with limited macro data available, markets could use these figures as a proxy for broader economic activity.

Economic Indicators:

  1. CPI: Consumer Price Index measures the average change in prices paid by consumers for goods and services over time. Source: Bureau of Labor Statistics.
  2. Core CPI: Core Consumer Price Index excludes food and energy prices to provide a clearer picture of long-term inflation trends. Source: Bureau of Labor Statistics.
  3. PPI: Producer Price Index measures the average change in selling prices received by domestic producers for their output. Source: Bureau of Labor Statistics.
  4. Core PPI: Core Producer Price Index excludes food and energy prices to provide a clearer picture of long-term inflation trends. Source: Bureau of Labor Statistics.
  5. PCE: Personal Consumption Expenditures measure the average change in prices paid by consumers for goods and services. Source: Bureau of Economic Analysis.
  6. Core PCE: Core Personal Consumption Expenditures exclude food and energy prices to provide a clearer picture of long-term inflation trends. Source: Bureau of Economic Analysis.
  7. Industrial Production: Measures the output of the industrial sector, including manufacturing, mining, and utilities. Source: Federal Reserve.
  8. Mfg New Orders: Measures the value of new orders placed with manufacturers for durable and non-durable goods. Source: Census Bureau.
  9. Durable New Orders: Measures the value of new orders placed with manufacturers of durable goods. Source: Census Bureau.
  10. Durable Inventories: Measures the value of inventories held by manufacturers for durable goods. Source: Census Bureau.
  11. Consumer Confidence (CB, 1985=100): Measures the degree of optimism that consumers feel about the overall state of the economy and their personal financial situation. Source: Conference Board.
  12. ISM Manufacturing Report: Measures the economic health of the manufacturing sector based on surveys of purchasing managers. Source: Institute for Supply Management.
  13. ISM Non-Manufacturing Report: Measures the economic health of the non-manufacturing sector based on surveys of purchasing managers. Source: Institute for Supply Management.
  14. Leading Economic Index: Measures overall economic activity and predicts future economic trends. Source: Conference Board.
  15. Building Permits (Mil. of Units, saar): Measures the number of new residential building permits issued. Source: Census Bureau.
  16. Housing Starts (Mil. of Units, saar): Measures the number of new residential construction projects that have begun. Source: Census Bureau.
  17. New Home Sales (Mil. of Units, saar): Measures the number of newly constructed homes sold. Source: Census Bureau.
  18. SA: Seasonally adjusted.
  19. SAAR: Seasonally adjusted annual rate.

Market Indices & Indicators:

  1. S&P 500: A market-capitalization-weighted index of 500 leading publicly traded companies in the U.S., widely regarded as one of the best gauges of large U.S. stocks and the stock market overall.
  2. Dow Jones 30: Also known as the Dow Jones Industrial Average, it tracks the share price performance of 30 large, publicly traded U.S. companies, serving as a barometer of the stock market and economy.
  3. NASDAQ: The world’s first electronic stock exchange, primarily listing technology giants and operating 29 markets globally.
  4. Russell 1000 Growth: Measures the performance of large-cap growth segment of the U.S. equity universe, including companies with higher price-to-book ratios and growth metrics.
  5. Russell 1000 Value: Measures the performance of large-cap value segment of the U.S. equity universe, including companies with lower price-to-book ratios and growth metrics.
  6. Russell 2000: A market index composed of 2,000 small-cap companies, widely used as a benchmark for small-cap mutual funds.
  7. Wilshire 5000: A market-capitalization-weighted index capturing the performance of all American stocks actively traded in the U.S., representing the broadest measure of the U.S. stock market.
  8. MSCI EAFE Index: An equity index capturing large and mid-cap representation across developed markets countries around the world, excluding the U.S. and Canada.
  9. MSCI Emerging Market Index: Captures large and mid-cap representation across emerging markets countries, covering approximately 85% of the free float-adjusted market capitalization in each country.
  10. VIX: The CBOE Volatility Index measures the market’s expectations for volatility over the coming 30 days, often referred to as the “fear gauge.”
  11. FTSE NAREIT All Equity REITs: Measures the performance of all publicly traded equity real estate investment trusts (REITs) listed in the U.S., excluding mortgage REITs.
  12. S&P U.S. Aggregate Bond Index: Represents the performance of the U.S. investment-grade bond market, including government, corporate, mortgage-backed, and asset-backed securities.
  13. 3-Month T-bill Yield (%): The yield on U.S. Treasury bills with a maturity of three months, reflecting short-term interest rates.
  14. 10-Year Treasury Yield (%): The yield on U.S. Treasury bonds with a maturity of ten years, reflecting long-term interest rates.
  15. 10Y-2Y Treasury Spread (%): The difference between the yields on 10-year and 2-year U.S. Treasury bonds, often used as an indicator of economic expectations.
  16. WTI Crude ($/bl): The price per barrel of West Texas Intermediate crude oil, a benchmark for U.S. oil prices.
  17. Gold ($/Troy Oz): The price per troy ounce of gold, a standard measure for gold prices.
  18. Bitcoin: A decentralized digital currency without a central bank or single administrator, which can be sent from user to user on the peer-to-peer bitcoin network.

This content was developed by Cambridge from sources believed to be reliable. This content is provided for informational purposes only and should not be construed or acted upon as individualized investment advice. It should not be considered a recommendation or solicitation. Information is subject to change. Any forward-looking statements are based on assumptions, may not materialize, and are subject to revision without notice. The information in this material is not intended as tax or legal advice.

Investing involves risk. Depending on the different types of investments there may be varying degrees of risk. Socially responsible investing does not guarantee any amount of success. Clients and prospective clients should be prepared to bear investment loss including loss of original principal. Indices mentioned are unmanaged and cannot be invested into directly. Past performance is not a guarantee of future results.

The Dow Jones Industrial Average (DJIA) is a price-weighted index composed of 30 widely traded blue-chip U.S. common stocks. The S&P 500 is a market-cap weighted index composed of the common stocks of 500 leading companies in leading industries of the U.S. economy. The NASDAQ Composite Index is a market-value weighted index of all common stocks listed on the NASDAQ stock exchange.

Securities offered through Cambridge Investment Research, Inc., a broker-dealer, member FINRA/SIPC, and investment advisory services offered through Cambridge Investment Research Advisors, Inc., a Registered Investment Adviser. Both are wholly-owned subsidiaries of Cambridge Investment Group, Inc. V.CIR.1025-3944

Market Commentary | October 20th, 2025

Market Commentary | October 20th, 2025

Weekly Market Commentary

October 20th, 2025

Week in Review…

Economic developments during the week were shaped by key inflation data, central bank commentary, and disruptions caused by the ongoing government shutdown. Together, these events offered insight into the Federal Reserve’s evolving stance and the challenges of navigating a data-constrained environment.

On Tuesday, October 14, Fed Chair Jerome Powell addressed the National Association for Business Economics, warning of “significant downside risks” in the labor market and signaling that the Fed may soon end its balance sheet runoff. Powell emphasized the difficulty of operating without full government data, noting reliance on private labor indicators and that substitutes for official inflation data are “less good.” His remarks reinforced expectations for a more cautious and dovish policy approach.

On Wednesday, the Consumer Price Index (CPI) for September showed a 0.4% month-over-month increase, while Core CPI rose 0.3%, bringing the year-over-year Core CPI to 3.7%. These figures suggest inflation remains persistent but is not accelerating, supporting the view that price pressures are stabilizing.

Thursday’s Producer Price Index (PPI) added complexity to the inflation picture. Headline PPI rose 0.5%, and Core PPI increased 0.3%, reversing the prior month’s decline. The data hinted at renewed wholesale cost pressures, which could eventually filter into consumer prices.

Meanwhile, the government shut down delayed several key reports, including retail sales and the full employment summary. Bloomberg and other sources reported that CPI data collection was strained, and policymakers are increasingly “flying blind” without timely indicators. The shutdown has created a data vacuum, complicating the Fed’s ability to assess economic conditions accurately.

Overall, the week highlighted the Fed’s balancing act: stabilizing inflation, monitoring labor risks, and adjusting policy amid limited visibility. Powell’s tone and the inflation data suggest a shift toward caution as uncertainty grows.

Economic and Capital Markets Dashboard

Week Ahead…

With the government shutdown still in effect, markets continue to operate in a data-constrained environment. The September jobs report remains delayed, and other key releases, including weekly jobless claims and the retail sales report, are also postponed. Even the Consumer Price Index, originally scheduled for October 15, has been pushed to October 24 to support Social Security Cost-of-Living Adjustment (COLA) calculations.

In the absence of fresh government data, investors will increasingly rely on private-sector releases and Fed communications. This week features a heavy slate of speeches from Federal Reserve officials, including Vice Chair Bowman and Governor Barr. With Chair Powell’s expected departure in 2026, markets may begin shifting their attention toward the broader committee for clues on the future policy path, especially as consensus-building becomes more critical in a fragmented data environment.

Additionally, global energy reports may offer indirect insights into economic momentum. The OPEC Monthly Oil Market Report (October 13) and the IEA Monthly Oil Market Report (October 14) will provide detailed views on oil supply, demand, and pricing trends. These reports, unaffected by the shutdown, may help markets assess inflationary pressures and industrial activity through the lens of energy consumption and production.

In this environment, every speech, survey, and tangential indicator may begin to take on outsized importance as markets prepare for the Fed’s October 28–29 meeting.

Economic Indicators:

  1. CPI: Consumer Price Index measures the average change in prices paid by consumers for goods and services over time. Source: Bureau of Labor Statistics.
  2. Core CPI: Core Consumer Price Index excludes food and energy prices to provide a clearer picture of long-term inflation trends. Source: Bureau of Labor Statistics.
  3. PPI: Producer Price Index measures the average change in selling prices received by domestic producers for their output. Source: Bureau of Labor Statistics.
  4. Core PPI: Core Producer Price Index excludes food and energy prices to provide a clearer picture of long-term inflation trends. Source: Bureau of Labor Statistics.
  5. PCE: Personal Consumption Expenditures measure the average change in prices paid by consumers for goods and services. Source: Bureau of Economic Analysis.
  6. Core PCE: Core Personal Consumption Expenditures exclude food and energy prices to provide a clearer picture of long-term inflation trends. Source: Bureau of Economic Analysis.
  7. Industrial Production: Measures the output of the industrial sector, including manufacturing, mining, and utilities. Source: Federal Reserve.
  8. Mfg New Orders: Measures the value of new orders placed with manufacturers for durable and non-durable goods. Source: Census Bureau.
  9. Durable New Orders: Measures the value of new orders placed with manufacturers of durable goods. Source: Census Bureau.
  10. Durable Inventories: Measures the value of inventories held by manufacturers for durable goods. Source: Census Bureau.
  11. Consumer Confidence (CB, 1985=100): Measures the degree of optimism that consumers feel about the overall state of the economy and their personal financial situation. Source: Conference Board.
  12. ISM Manufacturing Report: Measures the economic health of the manufacturing sector based on surveys of purchasing managers. Source: Institute for Supply Management.
  13. ISM Non-Manufacturing Report: Measures the economic health of the non-manufacturing sector based on surveys of purchasing managers. Source: Institute for Supply Management.
  14. Leading Economic Index: Measures overall economic activity and predicts future economic trends. Source: Conference Board.
  15. Building Permits (Mil. of Units, saar): Measures the number of new residential building permits issued. Source: Census Bureau.
  16. Housing Starts (Mil. of Units, saar): Measures the number of new residential construction projects that have begun. Source: Census Bureau.
  17. New Home Sales (Mil. of Units, saar): Measures the number of newly constructed homes sold. Source: Census Bureau.
  18. SA: Seasonally adjusted.
  19. SAAR: Seasonally adjusted annual rate.

Market Indices & Indicators:

  1. S&P 500: A market-capitalization-weighted index of 500 leading publicly traded companies in the U.S., widely regarded as one of the best gauges of large U.S. stocks and the stock market overall.
  2. Dow Jones 30: Also known as the Dow Jones Industrial Average, it tracks the share price performance of 30 large, publicly traded U.S. companies, serving as a barometer of the stock market and economy.
  3. NASDAQ: The world’s first electronic stock exchange, primarily listing technology giants and operating 29 markets globally.
  4. Russell 1000 Growth: Measures the performance of large-cap growth segment of the U.S. equity universe, including companies with higher price-to-book ratios and growth metrics.
  5. Russell 1000 Value: Measures the performance of large-cap value segment of the U.S. equity universe, including companies with lower price-to-book ratios and growth metrics.
  6. Russell 2000: A market index composed of 2,000 small-cap companies, widely used as a benchmark for small-cap mutual funds.
  7. Wilshire 5000: A market-capitalization-weighted index capturing the performance of all American stocks actively traded in the U.S., representing the broadest measure of the U.S. stock market.
  8. MSCI EAFE Index: An equity index capturing large and mid-cap representation across developed markets countries around the world, excluding the U.S. and Canada.
  9. MSCI Emerging Market Index: Captures large and mid-cap representation across emerging markets countries, covering approximately 85% of the free float-adjusted market capitalization in each country.
  10. VIX: The CBOE Volatility Index measures the market’s expectations for volatility over the coming 30 days, often referred to as the “fear gauge.”
  11. FTSE NAREIT All Equity REITs: Measures the performance of all publicly traded equity real estate investment trusts (REITs) listed in the U.S., excluding mortgage REITs.
  12. S&P U.S. Aggregate Bond Index: Represents the performance of the U.S. investment-grade bond market, including government, corporate, mortgage-backed, and asset-backed securities.
  13. 3-Month T-bill Yield (%): The yield on U.S. Treasury bills with a maturity of three months, reflecting short-term interest rates.
  14. 10-Year Treasury Yield (%): The yield on U.S. Treasury bonds with a maturity of ten years, reflecting long-term interest rates.
  15. 10Y-2Y Treasury Spread (%): The difference between the yields on 10-year and 2-year U.S. Treasury bonds, often used as an indicator of economic expectations.
  16. WTI Crude ($/bl): The price per barrel of West Texas Intermediate crude oil, a benchmark for U.S. oil prices.
  17. Gold ($/Troy Oz): The price per troy ounce of gold, a standard measure for gold prices.
  18. Bitcoin: A decentralized digital currency without a central bank or single administrator, which can be sent from user to user on the peer-to-peer bitcoin network.

This content was developed by Cambridge from sources believed to be reliable. This content is provided for informational purposes only and should not be construed or acted upon as individualized investment advice. It should not be considered a recommendation or solicitation. Information is subject to change. Any forward-looking statements are based on assumptions, may not materialize, and are subject to revision without notice. The information in this material is not intended as tax or legal advice.

Investing involves risk. Depending on the different types of investments there may be varying degrees of risk. Socially responsible investing does not guarantee any amount of success. Clients and prospective clients should be prepared to bear investment loss including loss of original principal. Indices mentioned are unmanaged and cannot be invested into directly. Past performance is not a guarantee of future results.

The Dow Jones Industrial Average (DJIA) is a price-weighted index composed of 30 widely traded blue-chip U.S. common stocks. The S&P 500 is a market-cap weighted index composed of the common stocks of 500 leading companies in leading industries of the U.S. economy. The NASDAQ Composite Index is a market-value weighted index of all common stocks listed on the NASDAQ stock exchange.

Securities offered through Cambridge Investment Research, Inc., a broker-dealer, member FINRA/SIPC, and investment advisory services offered through Cambridge Investment Research Advisors, Inc., a Registered Investment Adviser. Both are wholly-owned subsidiaries of Cambridge Investment Group, Inc. V.CIR.1025-3773

Market Commentary | April 21st, 2025

Market Commentary | April 21st, 2025

Weekly Market Commentary

April 21st, 2025

Week in Review…

U.S. equities experienced a downturn last week, reversing the sharp gains from the previous week. Both the S&P 500 and Nasdaq indices have now fallen for the third time in the last four weeks. Treasuries strengthened, leading to a steepening of the yield curve. For the week ending, April 18:

  • The S&P 500 declined by -1.50%
  • The Dow Jones Industrial Average fell by -2.66%
  • The tech-heavy Nasdaq dropped by -2.62%
  • The yield on the 10-Year Treasury rose to 4.34%, up from 4.10% at the end of the previous week

Due to the observance of Good Friday, this week had fewer economic data releases.

On Wednesday, retail sales data revealed a significant 1.4% increase in U.S. retail sales for March. This surge is largely due to consumers rushing to purchase vehicles before the 25% global car and truck tariffs took effect in early April. This follows a modest 0.2% rise in February. However, economic concerns are impacting discretionary spending, with high-income households continuing to drive spending while low-income consumers struggle.

The Federal Reserve delivered a speech on April 16, highlighting the potential for future interest rate adjustments and ongoing volatility in the bond market. Investors are closely monitoring U.S. Treasury yields, which have experienced increased volatility in recent weeks. The Fed’s comments have heightened speculation about the direction of monetary policy, contributing to market uncertainty and affecting global financial markets.

Spotlight

Secondaries Private Equity Market

Private equity (PE) involves investing capital in private companies in exchange for ownership. These companies are not publicly traded, and the capital typically comes from institutional and accredited investors, either directly or through managed funds. Unlike public equity, PE investments are long-term and illiquid. Broadly, as an asset class, PE encompasses various strategies, including venture capital, growth capital, buyouts, and secondary fund of funds investments.

Secondary private equity investments, or secondaries, involve purchasing existing stakes in PE funds from current investors. This market allows buyers to acquire mature, diversified portfolios, often at a discount, providing liquidity to the original investors. Transactions can include direct purchases of fund interests from limited partners (LPs) and general partners (GPs). Secondary-focused PE funds specialize in this market.

Initially, secondary investments offered liquidity to constrained LPs in a niche market with few buyers, stressed sellers, and steep discounts. Today, the secondary PE market is more about strategic portfolio realignment. The growth of the primary PE market has increased the volume of assets available for resale. The market now includes sophisticated entrants like pension funds, sovereign wealth funds, family offices, endowments, foundations, and private wealth intermediaries.

Economic volatility in public equities can create a compelling entry point for investors, driven by the denominator effect, where public pension funds are overallocated to alternative investments due to decline in public market positions. Secondary transactions help investors reduce GP relationships, comply with regulatory changes, and adjust allocation mandates. As institutional investors reduce PE exposure, new investors can purchase these positions at discounts.

Semi-liquid open-end tender fund structures have enabled accredited investors and qualified clients to access this growing market. Since 2010, PE secondaries assets under management have quadrupled, reaching nearly $509 billion by the end of 2024.

Source – Preqin, iCapital

(click image to expand)

However, investors should weigh the benefits and risks before deciding to allocate to this asset class.

Benefits and Risks of Secondary PE Investments

Benefits:

  1. Mitigation of the J-Curve Effect: Secondary investments can help mitigate the initial negative cash flow pattern typical of PE funds.
  2. Liquidity: Provides liquidity to original investors by allowing them to sell their stakes.
  3. Diversification: Buyers can acquire mature, diversified portfolios, often at a discount.
  4. Reduced Blind Pool Risk: Investors gain immediate exposure to established assets, allowing for more informed investment decisions.
  5. Discounted Entry: Secondary investments are often acquired at a discount, potentially enhancing returns.

Risks:

  1. Valuation Uncertainty: The valuation of secondary PE assets can be complex and may not always reflect current market conditions.
  2. Market Volatility: Secondary markets can be affected by broader economic conditions, impacting the value of investments.
  3. Manager Performance: The success of secondary investments heavily depends on the skill and experience of fund managers.

Source – Pitchbook, iCapital

(click image to expand)

Manager Selection and Evergreen Funds

Choosing skilled managers is critical in the secondary PE market due to the significant performance gap between top and bottom quartile managers.

Evergreen semi-liquid funds, such as interval and tender offer funds, now provide continuous access to private equity investments without a fixed end date. These funds pool capital from sophisticated investors to invest in a diversified portfolio of private companies. Unlike traditional closed-end funds, evergreen funds are open-ended, offering easier access to private market investments with lower minimum investments, a semi-liquid structure, and immediate exposure to the asset class.

The secondary PE market offers active opportunities for investors seeking liquidity, diversification, and potentially higher returns. However, it requires careful consideration of the associated risks and the selection of skilled managers. The advent of evergreen funds has democratized access to PE, allowing a wider range of investors to participate in this lucrative market.

Financial professionals are required to undergo additional training mandated by Cambridge and must adhere to Cambridge’s concentration guidelines when considering secondary PE funds for their clients.

Week Ahead…

The upcoming week is filled with significant economic data releases, starting with the Manufacturing Purchasing Managers’ Index (PMI), Services PMI, and New Home Sales.

The Manufacturing PMI and Services PMI are crucial indicators of economic health, measuring the activity levels of purchasing managers in the manufacturing and services sectors, respectively. These indices provide early insights into business conditions, helping investors and policymakers assess the strength of economic growth and potential inflationary pressures. New Home Sales data reflects the number of newly constructed homes sold in the previous month. This is a vital indicator of the housing market’s health and consumer confidence, as strong sales suggest robust demand and economic stability.

Towards the end of next week, we will see the release of Existing Home Sales and Durable Goods Orders. Existing Home Sales data provides a snapshot of the housing market’s performance, indicating the volume of previously owned homes sold during the month. Durable Goods Orders measure new orders placed with manufacturers for goods expected to last at least three years, such as appliances and vehicles.

J-Curve: In private equity, the J-Curve illustrates the typical pattern of investment returns. Initially, returns are negative due to upfront costs and fees. Over time, as investments mature and generate profits, returns increase significantly, forming a “J” shape. This reflects the transition from early losses to substantial gains as investments are successfully realized.

Blind Pool Risk: This refers to the risk associated with investing in a fund where the specific investments are not disclosed beforehand. Investors rely on the fund manager’s expertise and prior track record without knowing the exact assets or companies their money will be invested.

This content was developed by Cambridge from sources believed to be reliable. This content is provided for informational purposes only and should not be construed or acted upon as individualized investment advice. It should not be considered a recommendation or solicitation. Information is subject to change. Any forward-looking statements are based on assumptions, may not materialize, and are subject to revision without notice. The information in this material is not intended as tax or legal advice.

Investing involves risk. Depending on the different types of investments there may be varying degrees of risk. Socially responsible investing does not guarantee any amount of success. Clients and prospective clients should be prepared to bear investment loss including loss of original principal. Indices mentioned are unmanaged and cannot be invested into directly. Past performance is not a guarantee of future results.

The Dow Jones Industrial Average (DJIA) is a price-weighted index composed of 30 widely traded blue-chip U.S. common stocks. The S&P 500 is a market-cap weighted index composed of the common stocks of 500 leading companies in leading industries of the U.S. economy. The NASDAQ Composite Index is a market-value weighted index of all common stocks listed on the NASDAQ stock exchange.

An alternative investments strategy is subject to a number of risks and is not suitable for all investors. Investing in alternative investments is only intended for experienced and sophisticated investors who are willing to bear the high economic risk associated with such an investment. Certain risks may include but are not limited to the following: loss of all or a substantial portion of the investment, short selling or other speculative practices, lack of liquidity, volatility of returns, absence of information regarding valuations and pricing, complex tax structures and delays in tax reporting.

Securities offered through Cambridge Investment Research, Inc., a broker-dealer, member FINRA/SIPC, and investment advisory services offered through Cambridge Investment Research Advisors, Inc., a Registered Investment Adviser. Both are wholly-owned subsidiaries of Cambridge Investment Group, Inc. V.CIR.0425-1623