
Market Commentary | March 30th, 2026
Weekly Market Commentary
March 30th, 2026
Week in Review
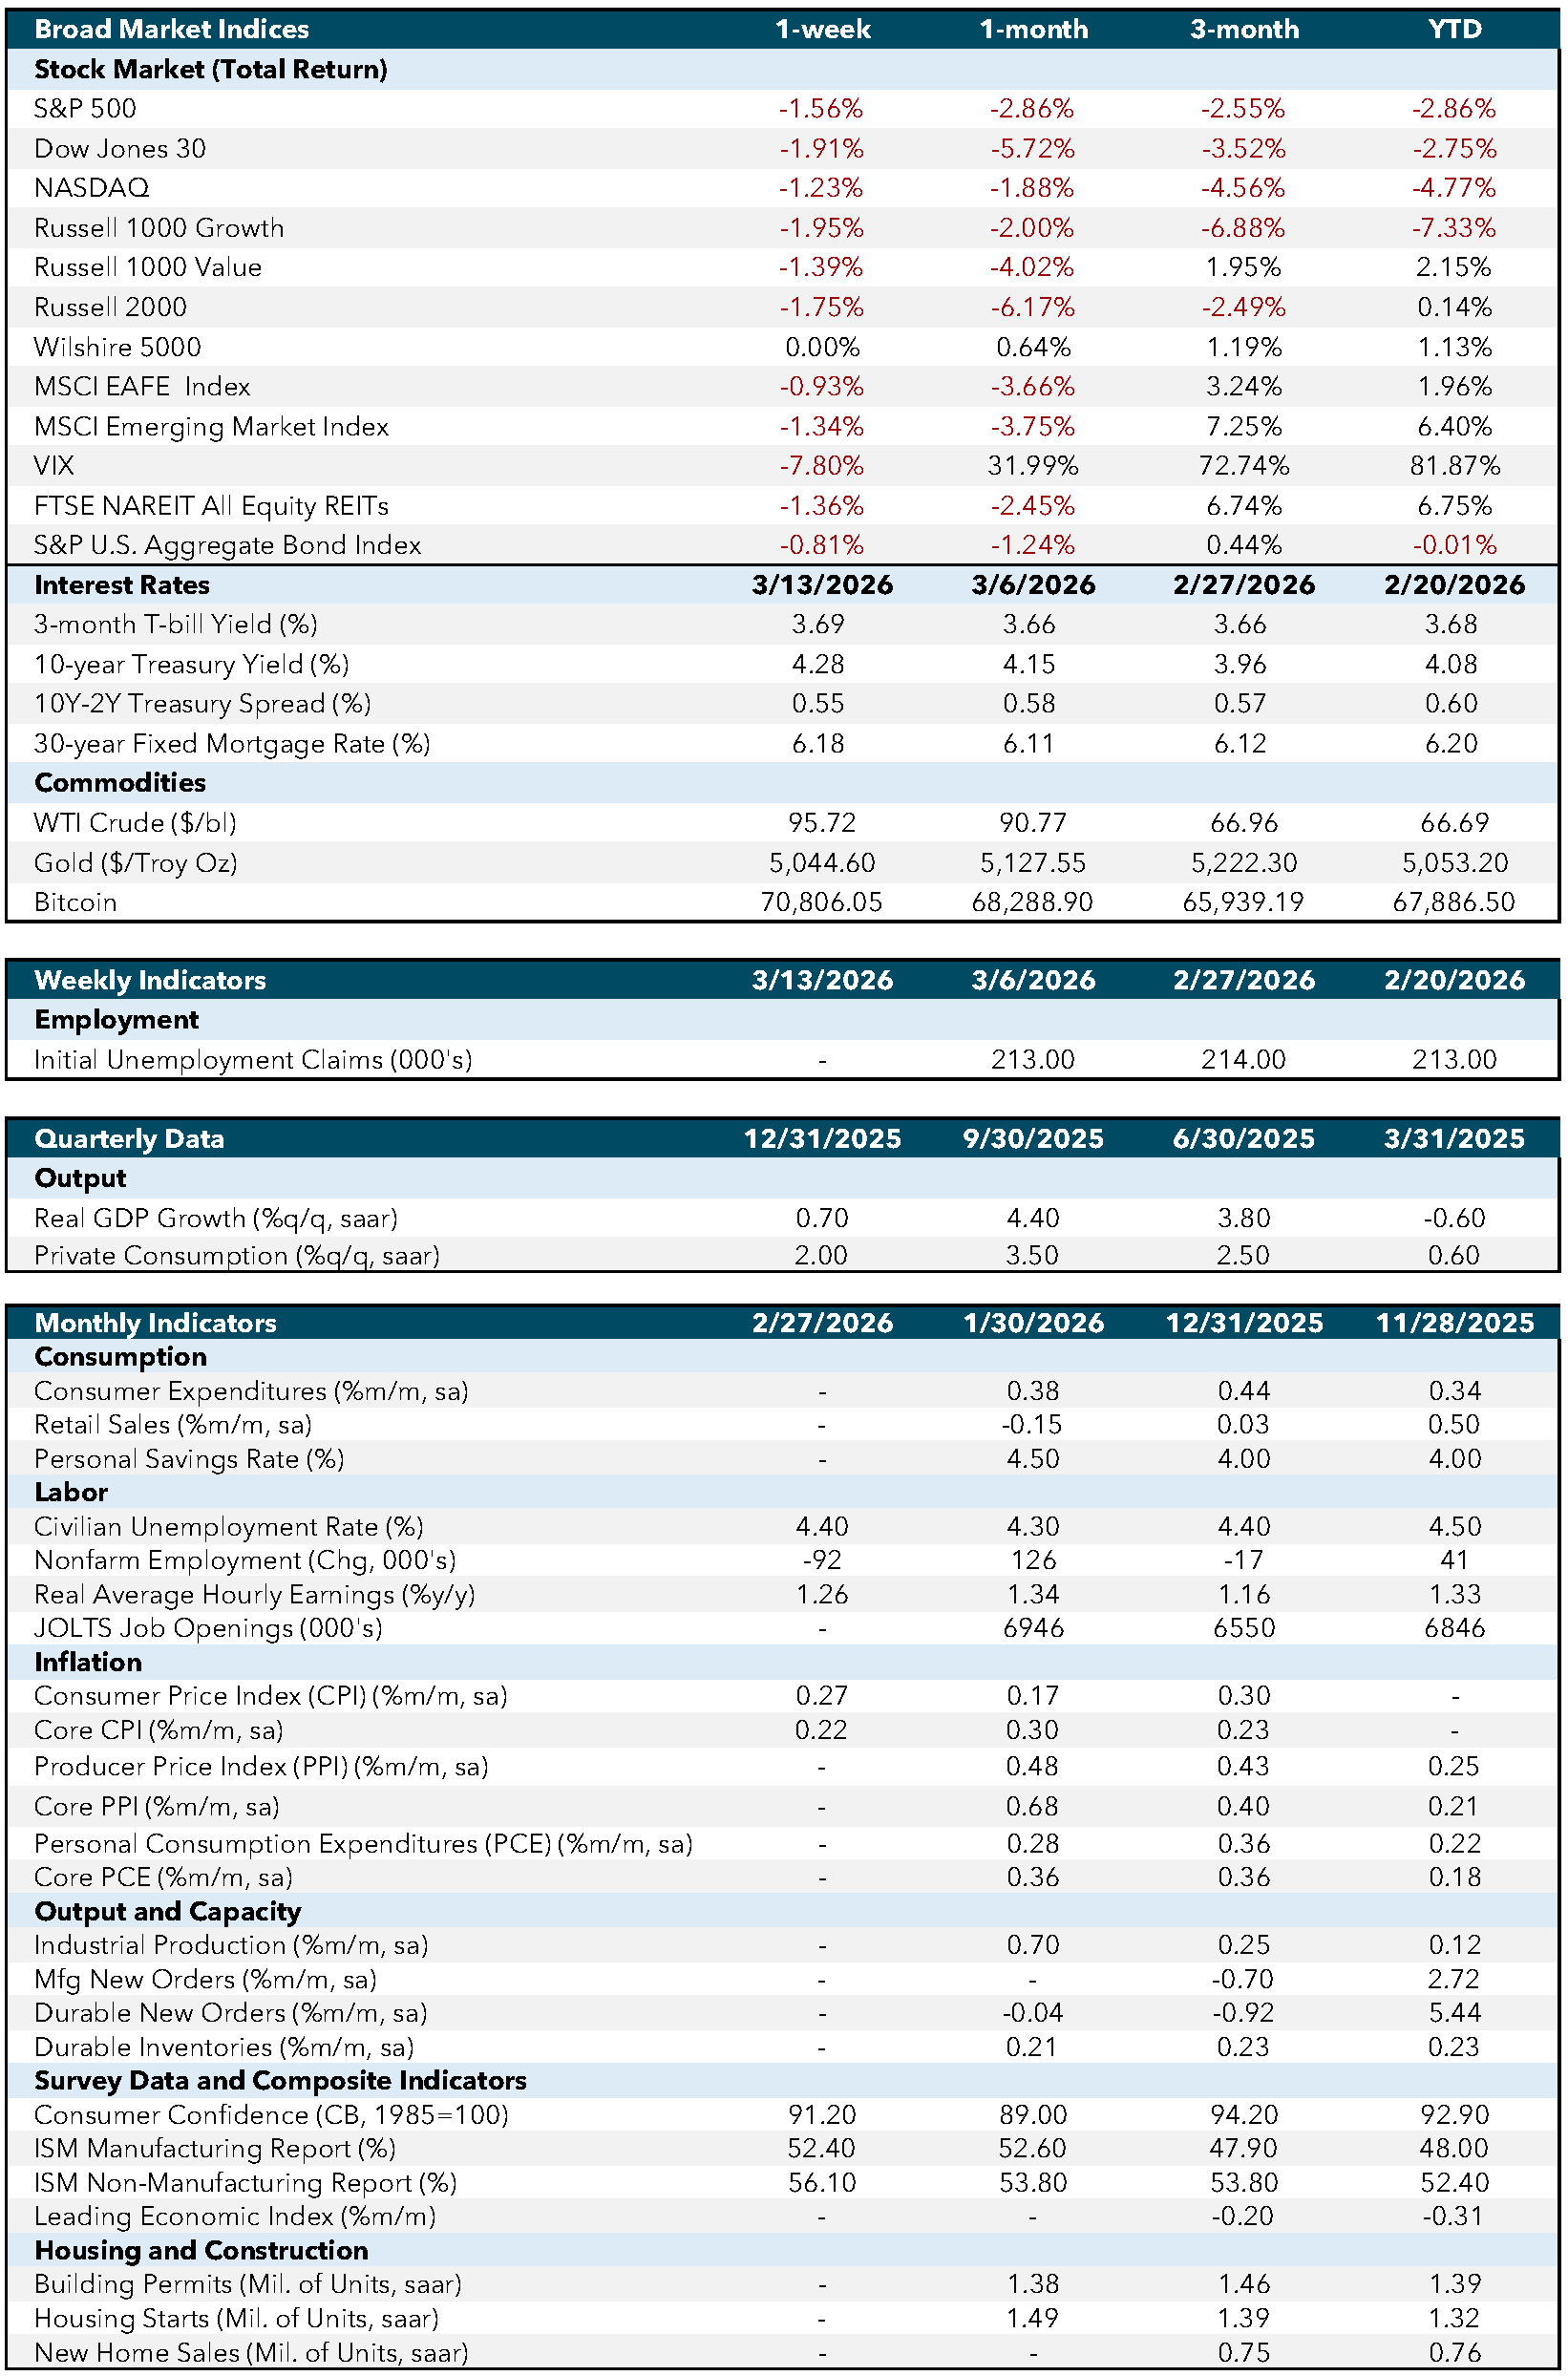
It was a short and relatively light week for economic data, but the releases still provided a useful snapshot of the economy. The main focus was the March flash Purchasing Managers’ Index (PMI) data, where S&P Global Flash U.S. Manufacturing PMI rose to 52.4 from 51.6, coming in above consensus of 51.3. That suggested factory activity remained in expansion and held up better than expected. On the services side, Flash U.S. Services PMI slipped to 51.1 from 51.7, coming in below expectations of 51.5. The softer services reading pulled the Composite PMI down to 51.4 from 51.9, its lowest level in nearly a year. The overall takeaway was a mixed but still positive one: manufacturing showed resilience, while services lost some momentum, pointing to continued growth but with a less broad-based foundation.
Labor data was also steady. Initial jobless claims rose by 5,000 to 210,000 for the week, broadly in line with expectations, while continuing claims fell by 32,000 to 1.819 million. That combination still points to a labor market that is cooling only gradually. Claims remain low by historical standards, and the drop in continuing claims suggests layoffs are still fairly contained, even if hiring demand is not especially strong. In other words, the labor backdrop continues to look more like “low-hire, low-fire” than outright deterioration.
Energy was another important piece of the week’s macro story. U.S. crude oil inventories unexpectedly rose by 6.9 million barrels, a much larger build than markets had anticipated. Normally, a large inventory build would imply softer demand or stronger supply, but this release landed in the context of an oil market still shaped by broader geopolitical and supply concerns. As a result, the data provided some near-term offset but did not fully remove inflation concerns tied to elevated energy prices. That remains important for the broader macro picture, since higher oil prices can pressure both consumers and business input costs.
Economic and Capital Markets Dashboard

Week Ahead…

The week ahead is more important, with several releases that should help clarify whether the economy is merely moderating or beginning to lose momentum more meaningfully. Chicago PMI will matter as an early read on business activity and whether the recent firmness in manufacturing is extending beyond the flash survey. Consumer Confidence will also be important because sentiment can influence spending behavior, especially when households are facing higher energy costs and broader uncertainty. The Job Openings and Labor Turnover Survey (JOLTS) report should provide another read on whether labor demand is continuing to normalize in an orderly way or whether hiring appetite is fading more decisively.
Later in the week, Retail Sales will be watched closely as a direct gauge of consumer demand. Since household spending remains the main engine of U.S. growth, this release will help markets judge whether consumers are still absorbing higher costs or becoming more cautious. Finally, Nonfarm Payrolls will likely be the key macro release of the week. More than any single series, payrolls help frame the broader balance between labor-market resilience, income support, and the economy’s ability to keep expanding without a sharper slowdown. Altogether, next week’s data should provide a much clearer read on the durability of demand and the degree to which slowing growth is becoming more visible in the hard data.
Economic Indicators:
- CPI: Consumer Price Index measures the average change in prices paid by consumers for goods and services over time. Source: Bureau of Labor Statistics.
- Core CPI: Core Consumer Price Index excludes food and energy prices to provide a clearer picture of long-term inflation trends. Source: Bureau of Labor Statistics.
- PPI: Producer Price Index measures the average change in selling prices received by domestic producers for their output. Source: Bureau of Labor Statistics.
- Core PPI: Core Producer Price Index excludes food and energy prices to provide a clearer picture of long-term inflation trends. Source: Bureau of Labor Statistics.
- PCE: Personal Consumption Expenditures measure the average change in prices paid by consumers for goods and services. Source: Bureau of Economic Analysis.
- Core PCE: Core Personal Consumption Expenditures exclude food and energy prices to provide a clearer picture of long-term inflation trends. Source: Bureau of Economic Analysis.
- Industrial Production: Measures the output of the industrial sector, including manufacturing, mining, and utilities. Source: Federal Reserve.
- Mfg New Orders: Measures the value of new orders placed with manufacturers for durable and non-durable goods. Source: Census Bureau.
- Durable New Orders: Measures the value of new orders placed with manufacturers of durable goods. Source: Census Bureau.
- Durable Inventories: Measures the value of inventories held by manufacturers for durable goods. Source: Census Bureau.
- Consumer Confidence (CB, 1985=100): Measures the degree of optimism that consumers feel about the overall state of the economy and their personal financial situation. Source: Conference Board.
- ISM Manufacturing Report: Measures the economic health of the manufacturing sector based on surveys of purchasing managers. Source: Institute for Supply Management.
- ISM Non-Manufacturing Report: Measures the economic health of the non-manufacturing sector based on surveys of purchasing managers. Source: Institute for Supply Management.
- Leading Economic Index: Measures overall economic activity and predicts future economic trends. Source: Conference Board.
- Building Permits (Mil. of Units, saar): Measures the number of new residential building permits issued. Source: Census Bureau.
- Housing Starts (Mil. of Units, saar): Measures the number of new residential construction projects that have begun. Source: Census Bureau.
- New Home Sales (Mil. of Units, saar): Measures the number of newly constructed homes sold. Source: Census Bureau.
- SA: Seasonally adjusted.
- SAAR: Seasonally adjusted annual rate.
Market Indices & Indicators:
- S&P 500: A market-capitalization-weighted index of 500 leading publicly traded companies in the U.S., widely regarded as one of the best gauges of large U.S. stocks and the stock market overall.
- Dow Jones 30: Also known as the Dow Jones Industrial Average, it tracks the share price performance of 30 large, publicly traded U.S. companies, serving as a barometer of the stock market and economy.
- NASDAQ: The world’s first electronic stock exchange, primarily listing technology giants and operating 29 markets globally.
- Russell 1000 Growth: Measures the performance of large-cap growth segment of the U.S. equity universe, including companies with higher price-to-book ratios and growth metrics.
- Russell 1000 Value: Measures the performance of large-cap value segment of the U.S. equity universe, including companies with lower price-to-book ratios and growth metrics.
- Russell 2000: A market index composed of 2,000 small-cap companies, widely used as a benchmark for small-cap mutual funds.
- Wilshire 5000: A market-capitalization-weighted index capturing the performance of all American stocks actively traded in the U.S., representing the broadest measure of the U.S. stock market.
- MSCI EAFE Index: An equity index capturing large and mid-cap representation across developed markets countries around the world, excluding the U.S. and Canada.
- MSCI Emerging Market Index: Captures large and mid-cap representation across emerging markets countries, covering approximately 85% of the free float-adjusted market capitalization in each country.
- VIX: The CBOE Volatility Index measures the market’s expectations for volatility over the coming 30 days, often referred to as the “fear gauge.”
- FTSE NAREIT All Equity REITs: Measures the performance of all publicly traded equity real estate investment trusts (REITs) listed in the U.S., excluding mortgage REITs.
- S&P U.S. Aggregate Bond Index: Represents the performance of the U.S. investment-grade bond market, including government, corporate, mortgage-backed, and asset-backed securities.
- 3-Month T-bill Yield (%): The yield on U.S. Treasury bills with a maturity of three months, reflecting short-term interest rates.
- 10-Year Treasury Yield (%): The yield on U.S. Treasury bonds with a maturity of ten years, reflecting long-term interest rates.
- 10Y-2Y Treasury Spread (%): The difference between the yields on 10-year and 2-year U.S. Treasury bonds, often used as an indicator of economic expectations.
- WTI Crude ($/bl): The price per barrel of West Texas Intermediate crude oil, a benchmark for U.S. oil prices.
- Gold ($/Troy Oz): The price per troy ounce of gold, a standard measure for gold prices.
- Bitcoin: A decentralized digital currency without a central bank or single administrator, which can be sent from user to user on the peer-to-peer bitcoin network.
This content was developed by Cambridge from sources believed to be reliable. This content is provided for informational purposes only and should not be construed or acted upon as individualized investment advice. It should not be considered a recommendation or solicitation. Information is subject to change. Any forward-looking statements are based on assumptions, may not materialize, and are subject to revision without notice. The information in this material is not intended as tax or legal advice.
Investing involves risk. Depending on the different types of investments there may be varying degrees of risk. Socially responsible investing does not guarantee any amount of success. Clients and prospective clients should be prepared to bear investment loss including loss of original principal. Indices mentioned are unmanaged and cannot be invested into directly. Past performance is not a guarantee of future results.
The Dow Jones Industrial Average (DJIA) is a price-weighted index composed of 30 widely traded blue-chip U.S. common stocks. The S&P 500 is a market-cap weighted index composed of the common stocks of 500 leading companies in leading industries of the U.S. economy. The NASDAQ Composite Index is a market-value weighted index of all common stocks listed on the NASDAQ stock exchange.
Securities offered through Cambridge Investment Research, Inc., a broker-dealer, member FINRA/SIPC, and investment advisory services offered through Cambridge Investment Research Advisors, Inc., a Registered Investment Adviser. Both are wholly-owned subsidiaries of Cambridge Investment Group, Inc. V.CIR.0326.1139