Market Commentary | June 15th, 2026

Market Commentary | June 15th, 2026

Weekly Market Commentary

June 15th, 2026

Week in Review

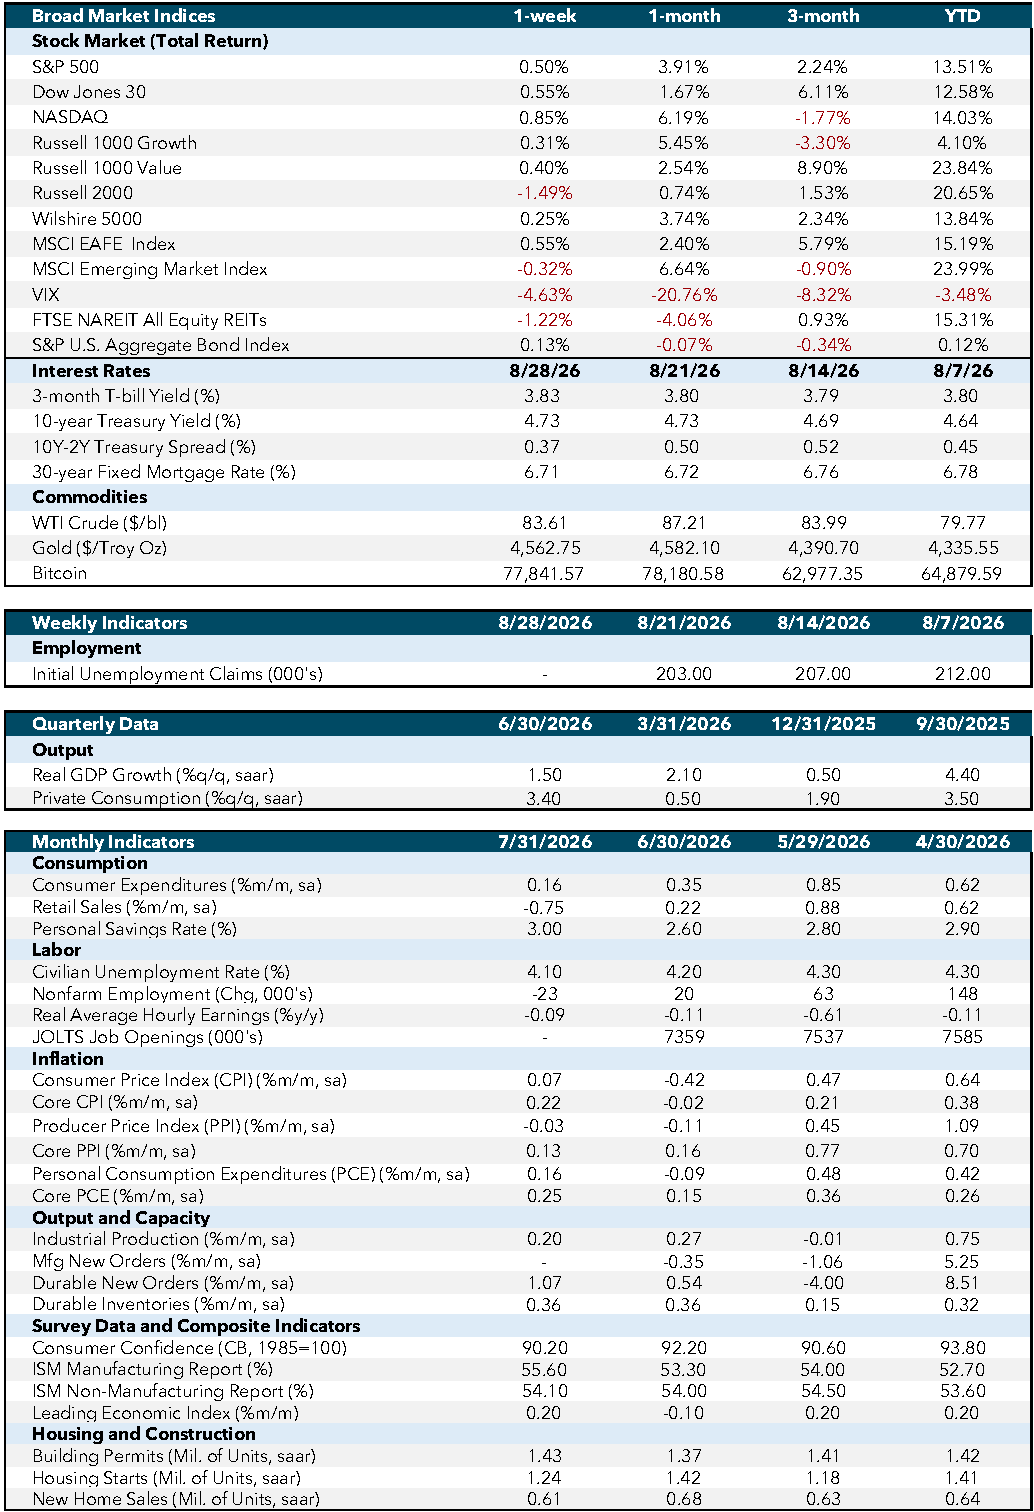
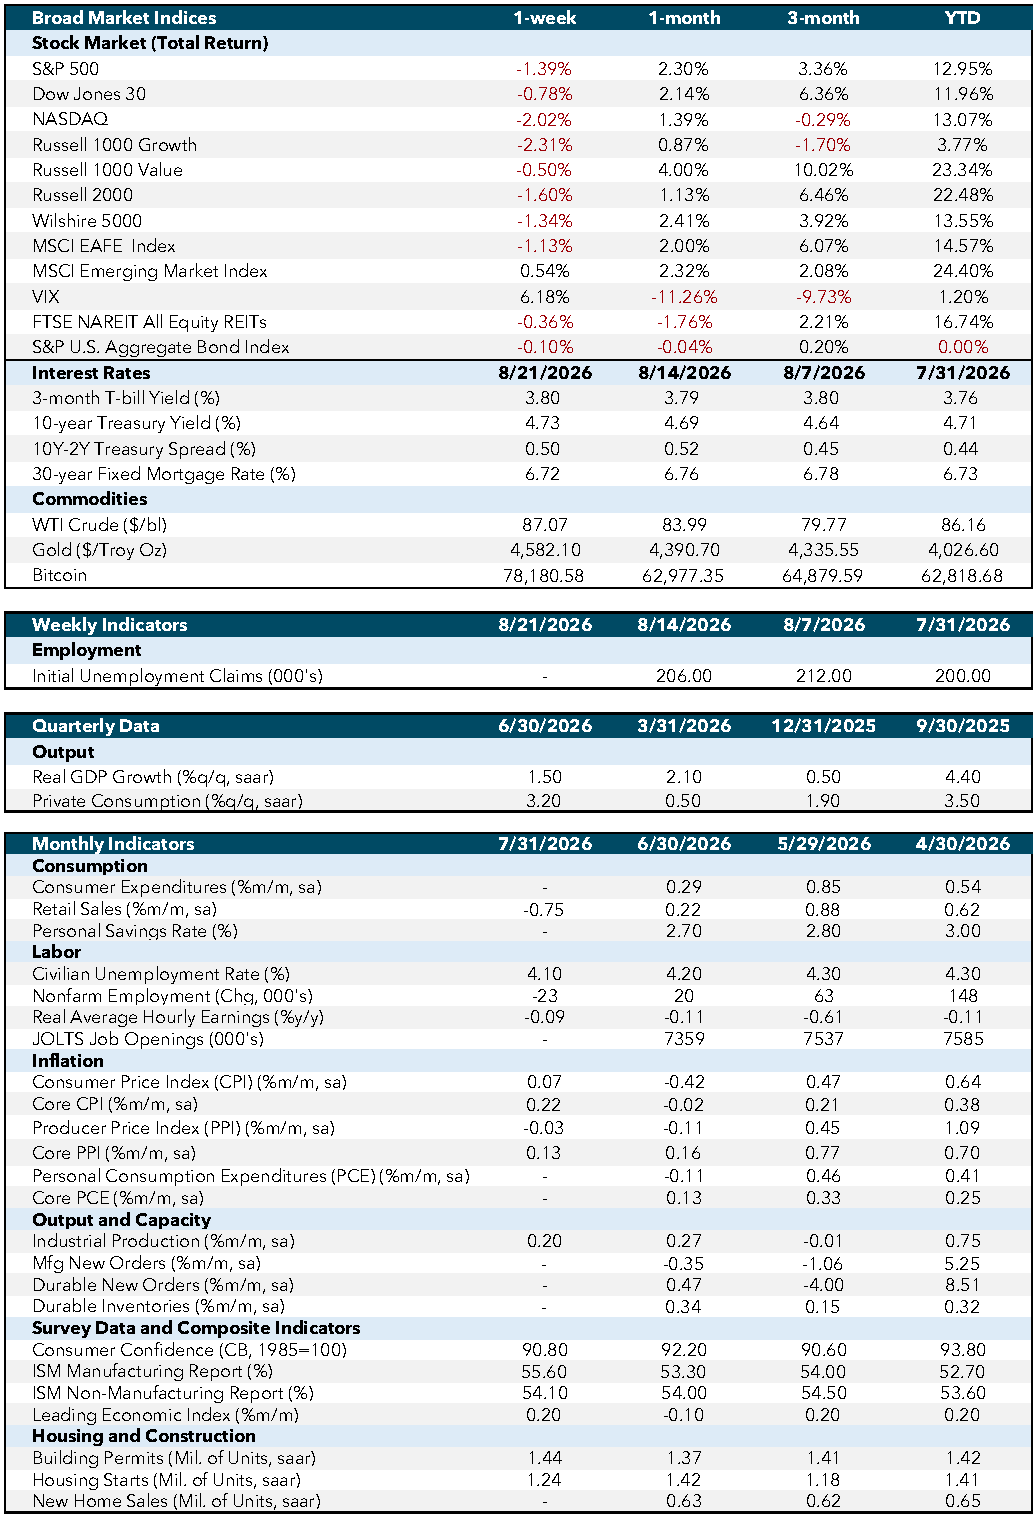
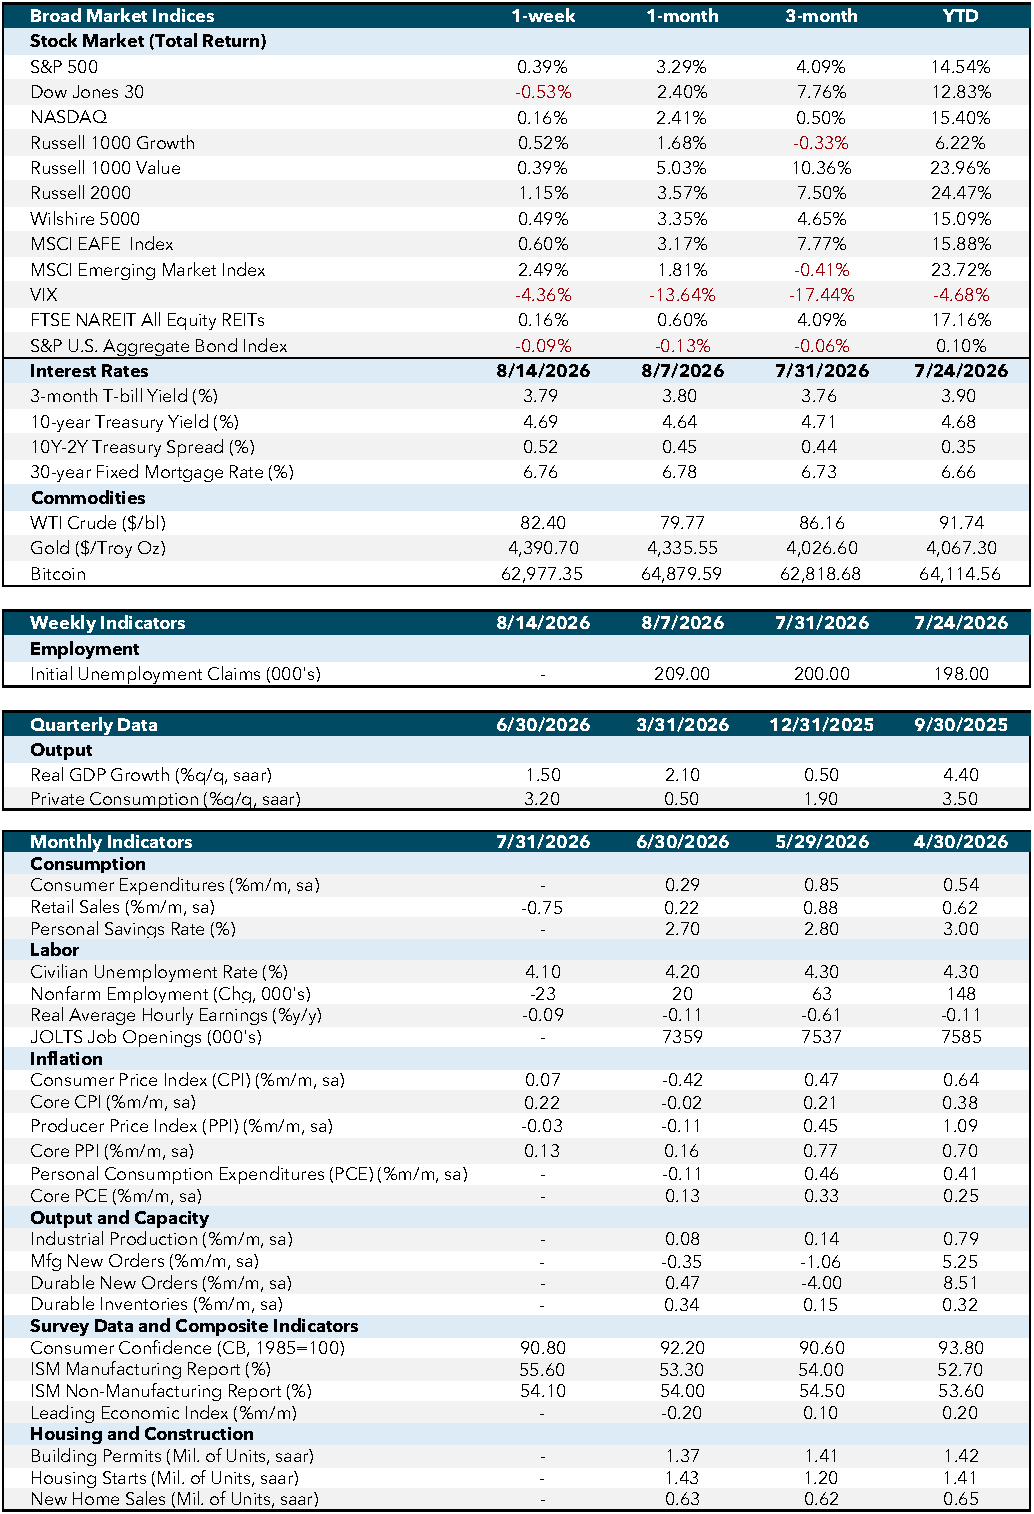
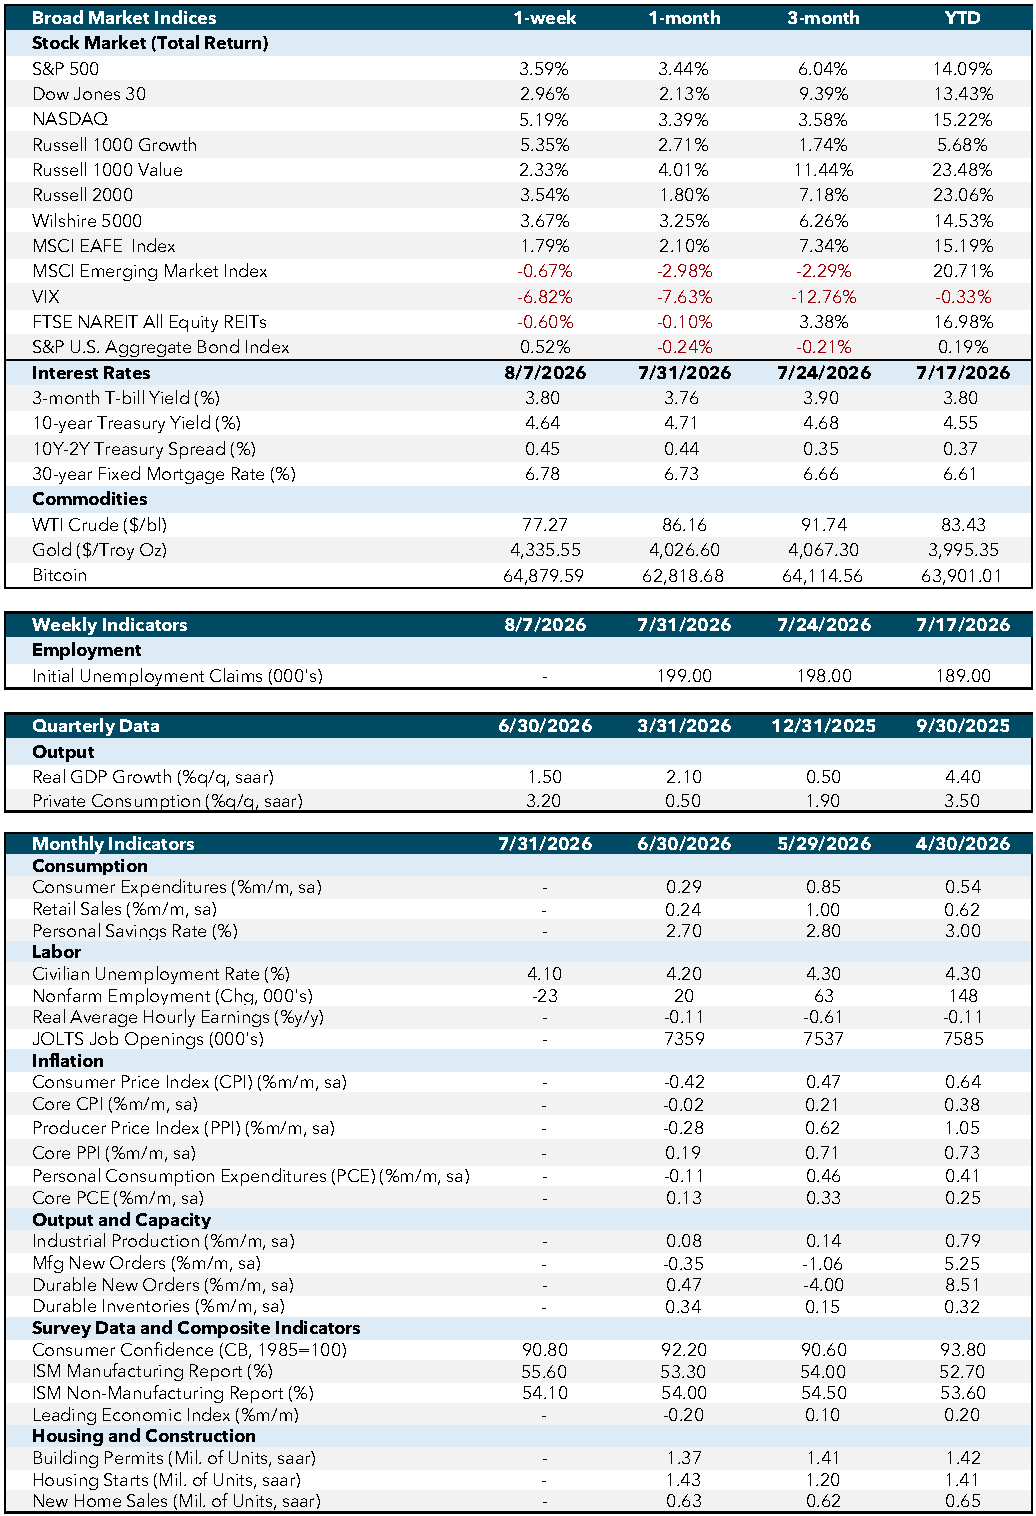
The past week was highlighted by a landmark capital markets event, as SpaceX completed a record-setting initial public offering (IPO), alongside economic data that pointed to steady growth with persistent inflation pressures.

SpaceX completed the largest IPO in history, raising approximately $75 billion, far exceeding the prior record set by Saudi Aramco. Shares were priced at $135, opened at $150, and closed near $161, representing a first-day gain of roughly 19%. By the end of trading, the company’s market capitalization exceeded $2 trillion, compared to roughly $1.77 trillion at IPO pricing, immediately positioning it among the largest publicly traded companies globally.

Demand for the offering was substantial, with reports indicating the deal was multiple times oversubscribed and total investor interest exceeding $200 billion. The successful execution and strong initial trading reinforce that public markets remain highly receptive to large-scale issuers and could support additional IPO activity, particularly as other highly anticipated listings, such as Anthropic and OpenAI, are expected to come to market later this year.

On the macro side, housing data came in stronger than expected, though the broader backdrop remains constrained. Existing home sales rose to 4.17 million, exceeding expectations near 4.07 million and marking a solid monthly increase. The upside surprise reflects continued resilience in demand, even as mortgage rates remain elevated.

Inflation data presented a more nuanced picture. The Consumer Price Index (CPI) increased 0.5% month-over-month and 4.2% year-over-year, in line with expectations and reaching a multi-year high. Much of the increase was driven by energy prices, which contributed significantly to the headline gain. In contrast, core CPI rose 0.2% month-over-month, below expectations, indicating that underlying inflation pressures remain more contained. This divergence suggests that recent inflation strength is being driven more by commodity-related factors rather than broad-based demand.

At the same time, producer price data indicates ongoing upstream pressure. The Producer Price Index (PPI) increased 1.1% month-over-month and 6.5% year-over-year, coming in above expectations and reflecting a sharp rise in goods prices, particularly energy-related components. This suggests that input costs remain firm, which could eventually pass through to consumer prices if sustained over the coming months.

Overall, last week’s developments reflect a market environment characterized by strong capital formation and steady economic activity, alongside persistent inflation dynamics. The success of the SpaceX IPO highlights continued strength in equity markets and investor demand, while economic data points to resilience in housing and an inflation backdrop that remains uneven.

Economic and Capital Markets Dashboard
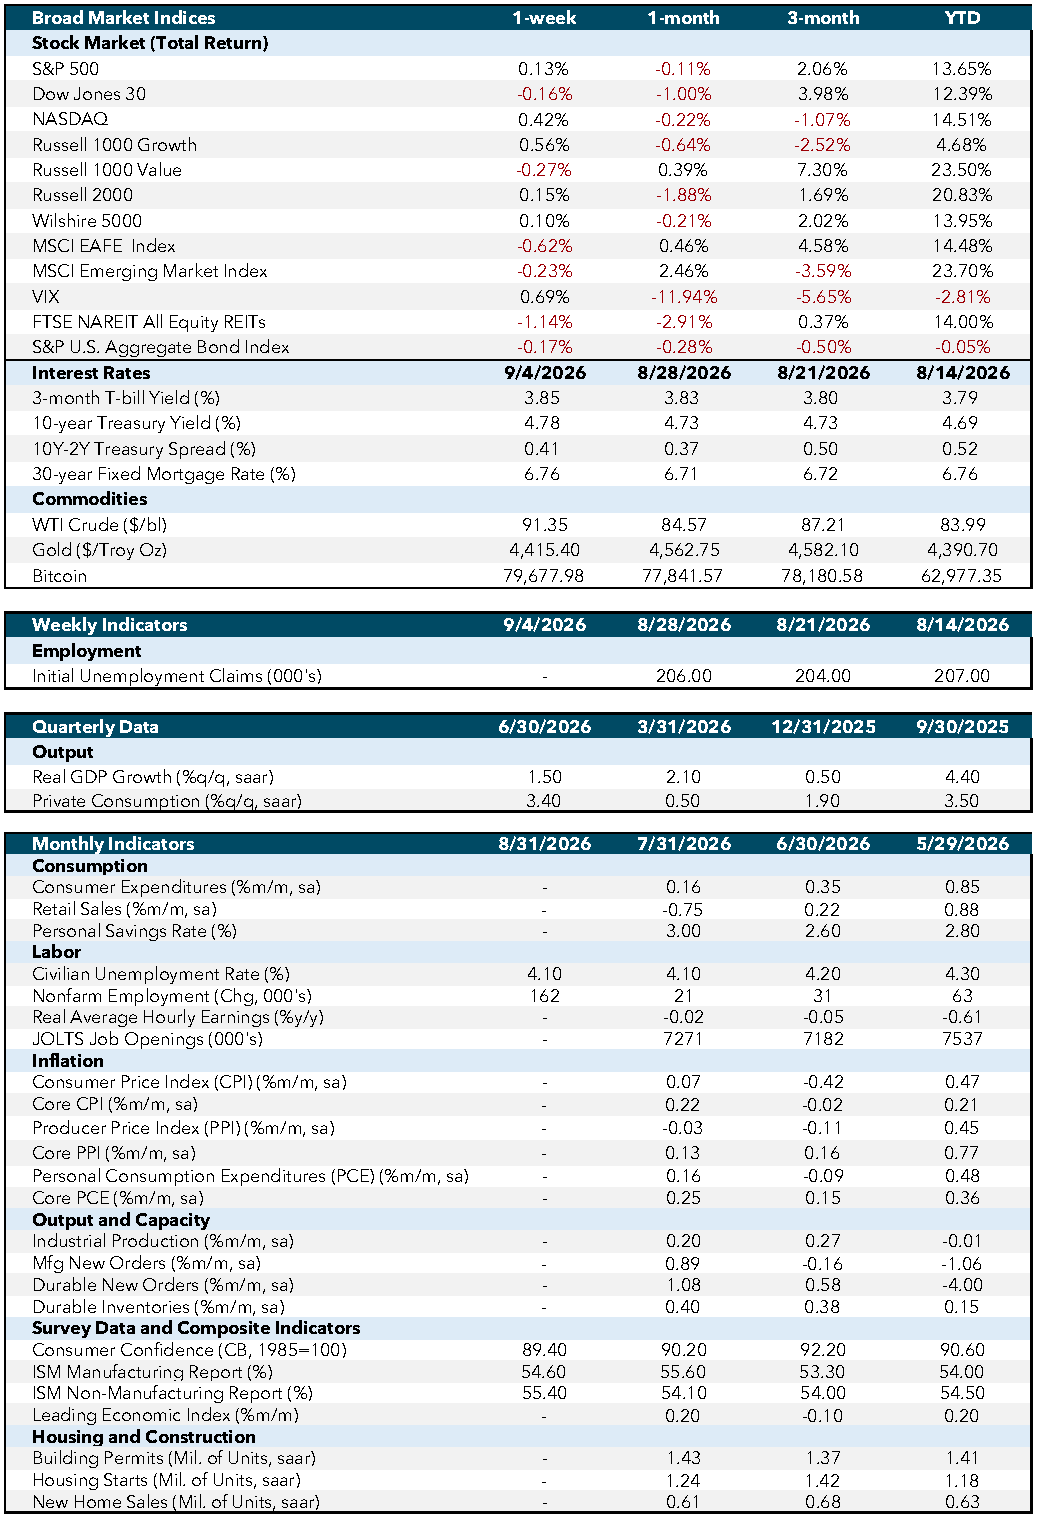
Week Ahead…

The upcoming week will focus on consumer demand, energy markets, and monetary policy.

Retail sales will provide an updated read on consumer spending. In the prior release, sales rose modestly from the previous month following a stronger gain earlier in the quarter, indicating continued growth but some moderation in momentum. The next print will help clarify whether spending remains steady or is beginning to slow.

Crude oil inventories will offer insight into supply conditions. Recent data showed a notable draw in inventories, extending a multi-week decline and leaving stockpiles below typical seasonal levels. The upcoming release will indicate whether that trend of tightening supply continues or begins to stabilize.

The Federal Open Market Committee (FOMC) rate decision and projections will be the key event of the week. At the last meeting, the Fed held rates unchanged, citing solid economic activity alongside inflation that remains above target, with elevated uncertainty around the outlook. The updated projections will provide insight into how policymakers are assessing growth, inflation, and the expected path of rates following recent data.

Overall, the week’s releases should help refine the near-term outlook for consumption, inflation pressures, and policy direction.

Economic Indicators:

  1. CPI: Consumer Price Index measures the average change in prices paid by consumers for goods and services over time. Source: Bureau of Labor Statistics.
  2. Core CPI: Core Consumer Price Index excludes food and energy prices to provide a clearer picture of long-term inflation trends. Source: Bureau of Labor Statistics.
  3. PPI: Producer Price Index measures the average change in selling prices received by domestic producers for their output. Source: Bureau of Labor Statistics.
  4. Core PPI: Core Producer Price Index excludes food and energy prices to provide a clearer picture of long-term inflation trends. Source: Bureau of Labor Statistics.
  5. PCE: Personal Consumption Expenditures measure the average change in prices paid by consumers for goods and services. Source: Bureau of Economic Analysis.
  6. Core PCE: Core Personal Consumption Expenditures exclude food and energy prices to provide a clearer picture of long-term inflation trends. Source: Bureau of Economic Analysis.
  7. Industrial Production: Measures the output of the industrial sector, including manufacturing, mining, and utilities. Source: Federal Reserve.
  8. Mfg New Orders: Measures the value of new orders placed with manufacturers for durable and non-durable goods. Source: Census Bureau.
  9. Durable New Orders: Measures the value of new orders placed with manufacturers of durable goods. Source: Census Bureau.
  10. Durable Inventories: Measures the value of inventories held by manufacturers for durable goods. Source: Census Bureau.
  11. Consumer Confidence (CB, 1985=100): Measures the degree of optimism that consumers feel about the overall state of the economy and their personal financial situation. Source: Conference Board.
  12. ISM Manufacturing Report: Measures the economic health of the manufacturing sector based on surveys of purchasing managers. Source: Institute for Supply Management.
  13. ISM Non-Manufacturing Report: Measures the economic health of the non-manufacturing sector based on surveys of purchasing managers. Source: Institute for Supply Management.
  14. Leading Economic Index: Measures overall economic activity and predicts future economic trends. Source: Conference Board.
  15. Building Permits (Mil. of Units, saar): Measures the number of new residential building permits issued. Source: Census Bureau.
  16. Housing Starts (Mil. of Units, saar): Measures the number of new residential construction projects that have begun. Source: Census Bureau.
  17. New Home Sales (Mil. of Units, saar): Measures the number of newly constructed homes sold. Source: Census Bureau.
  18. SA: Seasonally adjusted.
  19. SAAR: Seasonally adjusted annual rate.

Market Indices & Indicators:

  1. S&P 500: A market-capitalization-weighted index of 500 leading publicly traded companies in the U.S., widely regarded as one of the best gauges of large U.S. stocks and the stock market overall.
  2. Dow Jones 30: Also known as the Dow Jones Industrial Average, it tracks the share price performance of 30 large, publicly traded U.S. companies, serving as a barometer of the stock market and economy.
  3. NASDAQ: The world’s first electronic stock exchange, primarily listing technology giants and operating 29 markets globally.
  4. Russell 1000 Growth: Measures the performance of large-cap growth segment of the U.S. equity universe, including companies with higher price-to-book ratios and growth metrics.
  5. Russell 1000 Value: Measures the performance of large-cap value segment of the U.S. equity universe, including companies with lower price-to-book ratios and growth metrics.
  6. Russell 2000: A market index composed of 2,000 small-cap companies, widely used as a benchmark for small-cap mutual funds.
  7. Wilshire 5000: A market-capitalization-weighted index capturing the performance of all American stocks actively traded in the U.S., representing the broadest measure of the U.S. stock market.
  8. MSCI EAFE Index: An equity index capturing large and mid-cap representation across developed markets countries around the world, excluding the U.S. and Canada.
  9. MSCI Emerging Market Index: Captures large and mid-cap representation across emerging markets countries, covering approximately 85% of the free float-adjusted market capitalization in each country.
  10. VIX: The CBOE Volatility Index measures the market’s expectations for volatility over the coming 30 days, often referred to as the “fear gauge.”
  11. FTSE NAREIT All Equity REITs: Measures the performance of all publicly traded equity real estate investment trusts (REITs) listed in the U.S., excluding mortgage REITs.
  12. S&P U.S. Aggregate Bond Index: Represents the performance of the U.S. investment-grade bond market, including government, corporate, mortgage-backed, and asset-backed securities.
  13. 3-Month T-bill Yield (%): The yield on U.S. Treasury bills with a maturity of three months, reflecting short-term interest rates.
  14. 10-Year Treasury Yield (%): The yield on U.S. Treasury bonds with a maturity of ten years, reflecting long-term interest rates.
  15. 10Y-2Y Treasury Spread (%): The difference between the yields on 10-year and 2-year U.S. Treasury bonds, often used as an indicator of economic expectations.
  16. WTI Crude ($/bl): The price per barrel of West Texas Intermediate crude oil, a benchmark for U.S. oil prices.
  17. Gold ($/Troy Oz): The price per troy ounce of gold, a standard measure for gold prices.
  18. Bitcoin: A decentralized digital currency without a central bank or single administrator, which can be sent from user to user on the peer-to-peer bitcoin network.

This content was developed by Cambridge from sources believed to be reliable. This content is provided for informational purposes only and should not be construed or acted upon as individualized investment advice. It should not be considered a recommendation or solicitation. Information is subject to change. Any forward-looking statements are based on assumptions, may not materialize, and are subject to revision without notice. The information in this material is not intended as tax or legal advice.

Investing involves risk. Depending on the different types of investments there may be varying degrees of risk. Socially responsible investing does not guarantee any amount of success. Clients and prospective clients should be prepared to bear investment loss including loss of original principal. Indices mentioned are unmanaged and cannot be invested into directly. Past performance is not a guarantee of future results.

The Dow Jones Industrial Average (DJIA) is a price-weighted index composed of 30 widely traded blue-chip U.S. common stocks. The S&P 500 is a market-cap weighted index composed of the common stocks of 500 leading companies in leading industries of the U.S. economy. The NASDAQ Composite Index is a market-value weighted index of all common stocks listed on the NASDAQ stock exchange.

Securities offered through Cambridge Investment Research, Inc., a broker-dealer, member FINRA/SIPC, and investment advisory services offered through Cambridge Investment Research Advisors, Inc., a Registered Investment Adviser. Both are wholly-owned subsidiaries of Cambridge Investment Group, Inc. V.CIR.0626-2241

Market Commentary | June 8th, 2026

Market Commentary | June 8th, 2026

Weekly Market Commentary

June 8th, 2026

What SpaceX Reveals About Index Investing

SpaceX is expected to become one of the most valuable companies in the world, with valuations reportedly approaching $1.5 to $2 trillion. At that size, it would rank among the largest companies in the U.S. equity market. Yet even at that scale, it may not immediately appear in widely used market indexes such as the S&P 500.

More importantly, SpaceX is unlikely to be alone. Several large private companies are expected to come to market in the coming years, raising similar questions about how and when indexes incorporate new market leaders.

This highlights an important but often overlooked point for investors: index funds do not automatically own the “most important” companies in the market. Index inclusion depends on specific rules, not just company size. As a result, the absence or delayed inclusion of large companies, including SpaceX and others that may follow, can create differences in returns, risks, and performance comparisons that many investors do not expect.

The scale being discussed is not theoretical. At recent reported valuations, SpaceX would immediately rank among the largest companies in the U.S. equity market.

*Public company values as of 06/05/2026. SpaceX reflects reported IPO valuation.


Indexes Are Built on Rules, Not Just Size

Many investors assume that broad market indexes simply hold the largest companies. In reality, index construction is more selective.

For example, the S&P 500 requires companies to meet profitability standards, maintain a minimum level of publicly available shares, and typically trade for a period of time before being eligible. Other indexes, such as the Russell 1000 or Nasdaq 100, follow different methodologies and may include companies more quickly.

This raises a broader question for investors: are indexes designed to represent the market as it exists, or to apply certain quality or investability screens? The answer varies by index, which is why seemingly similar benchmarks can behave differently over time.

Because of these rules, indexes can also introduce subtle biases. Screens related to profitability, liquidity, or float can tilt an index toward certain types of companies, even if that is not the stated objective. In that sense, even “passive” exposure reflects a series of active design choices.

As more large private companies approach the public markets, these differences in index methodology are likely to become increasingly important for investors to understand.

When a Major Company Is Missing

When a company reaches a significant scale but is not included in an index, it creates a gap between the real economy and the benchmark investors use to measure performance.

First, the index may no longer fully represent the investable opportunity set. If one of the largest companies is absent, investors tracking that index are effectively underexposed to an important part of the market.

Second, return differences can emerge. Some indexes or actively managed portfolios may gain exposure earlier, while others may wait months or even years. Over time, this timing difference can lead to meaningful performance divergence, even among strategies that appear similar on the surface.

Finally, this creates tracking differences. If a portfolio holds a company that its benchmark does not, its performance will naturally deviate. These gaps are not necessarily the result of better or worse decision-making, they are often driven by differences in what is included in the benchmark itself.

In simple terms, if an investor holds a position that is absent from the benchmark, that position introduces its own independent source of volatility. Even at modest weights, this can contribute meaningfully to performance differences over time.

When Inclusion Finally Happens

The story does not end when a company is added to an index. In many cases, inclusion creates its own set of challenges.

Because passive funds are designed to track indexes, they must purchase newly added stocks, sometimes in large quantities and within a short period of time. For large IPOs, where the portion of shares available for trading may be limited, this demand can put pressure on prices and create short-term market distortions. This is one reason index providers apply liquidity and float requirements and are often cautious about adding newly public companies too quickly.

For large companies, these flows can be significant. As a result, index inclusion is not always a smooth process, and it can temporarily impact both individual stock behavior and index performance.

In this way, the issue is not just whether a company is included, but how and when that inclusion occurs.

Why This Matters for Investors

For clients, the key takeaway is that not all index exposure is identical. The choice of benchmark can influence both return outcomes and risk characteristics.

Differences in index construction can affect:

  • When new companies are added
  • How much weight they receive
  • How portfolios react to those changes

This also raises a broader question: What is a portfolio actually trying to track?

In many cases, investors use indexes as proxies for areas of the market, such as U.S. large-cap stocks. However, when index construction rules lead to meaningful differences in holdings, the benchmark may not fully capture the exposure an investor intended.

As more large private companies move toward the public markets, allocators will need to become more aware of differences in index construction to ensure their benchmark exposures align with the opportunity set they are seeking to capture.

In those situations, tracking differences between a portfolio and its benchmark may not reflect investment decisions alone. In some cases, they reflect differences in how the benchmark itself is constructed.

Final Thoughts

SpaceX is not just a story about a single company. It is part of a broader shift in which some of the largest companies in the economy are reaching public markets later and on a much larger scale.

As this trend continues, questions around index construction, inclusion timing, and benchmark differences are likely to become more relevant. Understanding how an index works, and what it includes or excludes, is an important part of building and evaluating a portfolio. In today’s market, knowing your benchmark is just as important as knowing your investments.

 Echo Wang and Milana Vinn, “SpaceX Sets $135 Price for Blockbuster IPO, Upending Wall Street Convention,” Reuters, June 3, 2026, https://www.reuters.com/legal/government/spacex-sets-135-price-blockbuster-ipo-upending-wall-street-convention-2026-06-03/.

This content was developed by Cambridge from sources believed to be reliable. This content is provided for informational purposes only and should not be construed or acted upon as individualized investment advice. It should not be considered a recommendation or solicitation. Information is subject to change. Any forward-looking statements are based on assumptions, may not materialize, and are subject to revision without notice. The information in this material is not intended as tax or legal advice.

Investing involves risk. Depending on the different types of investments there may be varying degrees of risk. Socially responsible investing does not guarantee any amount of success. Clients and prospective clients should be prepared to bear investment loss including loss of original principal. Indices mentioned are unmanaged and cannot be invested into directly. Past performance is not a guarantee of future results.

The Dow Jones Industrial Average (DJIA) is a price-weighted index composed of 30 widely traded blue-chip U.S. common stocks. The S&P 500 is a market-cap weighted index composed of the common stocks of 500 leading companies in leading industries of the U.S. economy. The NASDAQ Composite Index is a market-value weighted index of all common stocks listed on the NASDAQ stock exchange.

Market Commentary | June 1st, 2026

Market Commentary | June 1st, 2026

Weekly Market Commentary

June 1st, 2026

Week in Review

The latest round of data releases provided a more nuanced picture of the economy, highlighting a continued tension between moderating growth, persistent inflation pressures, and pockets of strength across key sectors.

The Consumer Confidence reading for May came in at 93.1, representing a slight decline from the prior month. While the headline softened modestly, the details were more balanced, with weaker views on current conditions offset by a small improvement in expectations. Overall, the data suggests the consumer remains in relatively solid shape, though signs of caution are beginning to emerge as higher prices weigh on sentiment.

The April New Home Sales release highlighted continued challenges in the housing sector. Sales fell 6.2% month-over-month to a 622,000 annualized pace, missing expectations and reversing some prior momentum. Also, housing inventories rose as elevated mortgage rates and affordability pressures continue to limit buyer activity. This dynamic suggests that housing remains a relatively weak spot within the economic outlook in the near term.

Thursday brought key updates on growth and inflation. The second estimate of first-quarter GDP showed expansion at a 1.6% annualized rate, revised lower from the initial reading, indicating some moderation in consumer spending and investment. At the same time, Personal Consumption Expenditures (PCE) inflation remained elevated, with both headline and core readings well above the Fed’s target. This highlights persistent price pressures and continues to keep the policy outlook constrained.

Friday’s Chicago Purchasing Managers’ Index (PMI) for May was a clear bright spot, rising to 62.7 from 49.2 in April. This sharp rebound, the strongest reading in over four years, points to a meaningful reacceleration in regional business activity and manufacturing momentum.

Meanwhile, crude oil inventories continued to draw down, with the latest Energy Information Administration (EIA) data showing a decline of approximately 3.3 million barrels for the week. This marks another week of tightening supply conditions, alongside declines in gasoline and distillate inventories.  The ongoing draws reinforce a firm supply-demand backdrop in energy markets, helping to explain continued upward movement in fuel prices and the persistence of inflationary pressures feeding through to consumers.

Overall, the data reinforced a mixed but consistent narrative. Growth is moderating, particularly in rate-sensitive sectors, while inflation remains elevated. At the same time, pockets of strength, especially in manufacturing, suggest that economic expansion remains intact, leaving the outlook dependent on how these crosscurrents evolve.

Economic and Capital Markets Dashboard

Week Ahead…

Looking ahead, the first full week of June features several key data releases that will help shape the near-term economic narrative, particularly around activity trends and labor market conditions.

Monday will bring the ISM Manufacturing PMI, which has recently pointed to steady expansion in the industrial sector. This release will serve as an important gauge of whether that momentum is continuing to hold, especially as input costs remain elevated and broader growth shows signs of moderation.

On Wednesday, attention will turn to the labor market with the ADP Employment report, offering an early look at private sector hiring trends. This may help to set expectations for broader payroll growth and provide insight into underlying employment dynamics.

Another important midweek release is the May ISM Non-Manufacturing PMI, a critical indicator given the sector’s outsized role in overall economic activity. Recent data has suggested some moderation, so this release will be key in determining whether services demand is stabilizing or continuing to ease.

Thursday features weekly jobless claims, which remain a timely barometer of labor market conditions. Claims have generally stayed contained, and any notable increase would signal a potential shift in employment trends.

The week will end with the May Employment Situation report, including nonfarm payrolls, the unemployment rate, and wage growth. This release will be central in assessing the strength of the labor market and the broader sustainability of economic growth.

Overall, these releases will provide a comprehensive update on both activity and employment conditions, helping to refine the market’s view on growth durability and the path forward for monetary policy.

Economic Indicators:

  1. CPI: Consumer Price Index measures the average change in prices paid by consumers for goods and services over time. Source: Bureau of Labor Statistics.
  2. Core CPI: Core Consumer Price Index excludes food and energy prices to provide a clearer picture of long-term inflation trends. Source: Bureau of Labor Statistics.
  3. PPI: Producer Price Index measures the average change in selling prices received by domestic producers for their output. Source: Bureau of Labor Statistics.
  4. Core PPI: Core Producer Price Index excludes food and energy prices to provide a clearer picture of long-term inflation trends. Source: Bureau of Labor Statistics.
  5. PCE: Personal Consumption Expenditures measure the average change in prices paid by consumers for goods and services. Source: Bureau of Economic Analysis.
  6. Core PCE: Core Personal Consumption Expenditures exclude food and energy prices to provide a clearer picture of long-term inflation trends. Source: Bureau of Economic Analysis.
  7. Industrial Production: Measures the output of the industrial sector, including manufacturing, mining, and utilities. Source: Federal Reserve.
  8. Mfg New Orders: Measures the value of new orders placed with manufacturers for durable and non-durable goods. Source: Census Bureau.
  9. Durable New Orders: Measures the value of new orders placed with manufacturers of durable goods. Source: Census Bureau.
  10. Durable Inventories: Measures the value of inventories held by manufacturers for durable goods. Source: Census Bureau.
  11. Consumer Confidence (CB, 1985=100): Measures the degree of optimism that consumers feel about the overall state of the economy and their personal financial situation. Source: Conference Board.
  12. ISM Manufacturing Report: Measures the economic health of the manufacturing sector based on surveys of purchasing managers. Source: Institute for Supply Management.
  13. ISM Non-Manufacturing Report: Measures the economic health of the non-manufacturing sector based on surveys of purchasing managers. Source: Institute for Supply Management.
  14. Leading Economic Index: Measures overall economic activity and predicts future economic trends. Source: Conference Board.
  15. Building Permits (Mil. of Units, saar): Measures the number of new residential building permits issued. Source: Census Bureau.
  16. Housing Starts (Mil. of Units, saar): Measures the number of new residential construction projects that have begun. Source: Census Bureau.
  17. New Home Sales (Mil. of Units, saar): Measures the number of newly constructed homes sold. Source: Census Bureau.
  18. SA: Seasonally adjusted.
  19. SAAR: Seasonally adjusted annual rate.

Market Indices & Indicators:

  1. S&P 500: A market-capitalization-weighted index of 500 leading publicly traded companies in the U.S., widely regarded as one of the best gauges of large U.S. stocks and the stock market overall.
  2. Dow Jones 30: Also known as the Dow Jones Industrial Average, it tracks the share price performance of 30 large, publicly traded U.S. companies, serving as a barometer of the stock market and economy.
  3. NASDAQ: The world’s first electronic stock exchange, primarily listing technology giants and operating 29 markets globally.
  4. Russell 1000 Growth: Measures the performance of large-cap growth segment of the U.S. equity universe, including companies with higher price-to-book ratios and growth metrics.
  5. Russell 1000 Value: Measures the performance of large-cap value segment of the U.S. equity universe, including companies with lower price-to-book ratios and growth metrics.
  6. Russell 2000: A market index composed of 2,000 small-cap companies, widely used as a benchmark for small-cap mutual funds.
  7. Wilshire 5000: A market-capitalization-weighted index capturing the performance of all American stocks actively traded in the U.S., representing the broadest measure of the U.S. stock market.
  8. MSCI EAFE Index: An equity index capturing large and mid-cap representation across developed markets countries around the world, excluding the U.S. and Canada.
  9. MSCI Emerging Market Index: Captures large and mid-cap representation across emerging markets countries, covering approximately 85% of the free float-adjusted market capitalization in each country.
  10. VIX: The CBOE Volatility Index measures the market’s expectations for volatility over the coming 30 days, often referred to as the “fear gauge.”
  11. FTSE NAREIT All Equity REITs: Measures the performance of all publicly traded equity real estate investment trusts (REITs) listed in the U.S., excluding mortgage REITs.
  12. S&P U.S. Aggregate Bond Index: Represents the performance of the U.S. investment-grade bond market, including government, corporate, mortgage-backed, and asset-backed securities.
  13. 3-Month T-bill Yield (%): The yield on U.S. Treasury bills with a maturity of three months, reflecting short-term interest rates.
  14. 10-Year Treasury Yield (%): The yield on U.S. Treasury bonds with a maturity of ten years, reflecting long-term interest rates.
  15. 10Y-2Y Treasury Spread (%): The difference between the yields on 10-year and 2-year U.S. Treasury bonds, often used as an indicator of economic expectations.
  16. WTI Crude ($/bl): The price per barrel of West Texas Intermediate crude oil, a benchmark for U.S. oil prices.
  17. Gold ($/Troy Oz): The price per troy ounce of gold, a standard measure for gold prices.
  18. Bitcoin: A decentralized digital currency without a central bank or single administrator, which can be sent from user to user on the peer-to-peer bitcoin network.

This content was developed by Cambridge from sources believed to be reliable. This content is provided for informational purposes only and should not be construed or acted upon as individualized investment advice. It should not be considered a recommendation or solicitation. Information is subject to change. Any forward-looking statements are based on assumptions, may not materialize, and are subject to revision without notice. The information in this material is not intended as tax or legal advice.

Investing involves risk. Depending on the different types of investments there may be varying degrees of risk. Socially responsible investing does not guarantee any amount of success. Clients and prospective clients should be prepared to bear investment loss including loss of original principal. Indices mentioned are unmanaged and cannot be invested into directly. Past performance is not a guarantee of future results.

The Dow Jones Industrial Average (DJIA) is a price-weighted index composed of 30 widely traded blue-chip U.S. common stocks. The S&P 500 is a market-cap weighted index composed of the common stocks of 500 leading companies in leading industries of the U.S. economy. The NASDAQ Composite Index is a market-value weighted index of all common stocks listed on the NASDAQ stock exchange.

Securities offered through Cambridge Investment Research, Inc., a broker-dealer, member FINRA/SIPC, and investment advisory services offered through Cambridge Investment Research Advisors, Inc., a Registered Investment Adviser. Both are wholly-owned subsidiaries of Cambridge Investment Group, Inc. V.CIR.0626-1996

Market Commentary | May 26th, 2026

Market Commentary | May 26th, 2026

Weekly Market Commentary

May 26th, 2026

Week in Review

Last week’s macro releases pointed to a resilient but slightly moderating economic backdrop. U.S. crude oil inventories recorded a sharp draw of -7.86 million barrels, well below expectations of roughly -2.5 million (prior: -4.3 million), indicating stronger demand and providing modest upward pressure on energy prices and inflation expectations. The Federal Open Market Committee (FOMC) meeting minutes reinforced a cautious, data-dependent stance, with policymakers signaling persistent inflation risks and little urgency to ease policy, supporting a higher-for-longer rate environment.

On activity data, Purchasing Managers’ Indexes (PMIs) were mixed but still constructive. Manufacturing surprised to the upside at 55.3 versus 53.8 expected, reflecting strong expansion in the industrial sector. In contrast, the Services PMI came in at 50.9 versus 51.1 expected, indicating continued expansion but modest cooling in momentum rather than outright weakness. This suggests some normalization in services demand while overall activity remains in growth territory.

Labor market conditions remain stable, with jobless claims continuing to track near low levels, consistent with a still-tight labor market and limited signs of deterioration.

Overall, the data reinforces a resilient growth environment with pockets of moderation, where strong manufacturing and firm labor conditions offset softer (but still expanding) services activity. Combined with tighter energy markets and a cautious Fed, this keeps inflation risks tilted to the upside, likely sustaining elevated rate expectations, upward pressure on yields, and a selective equity backdrop.

Economic and Capital Markets Dashboard

Week Ahead…

Looking ahead, the upcoming week is shortened due to the Memorial Day holiday but still features several key data releases that will help shape the near-term economic narrative.

Tuesday brings Consumer Confidence, which previously came in around 92.8, providing a benchmark for household sentiment and spending resilience. A stable or improving reading would reinforce the strength of the consumer as a key growth driver.

Wednesday features New Home Sales, following a prior release that showed a moderate pace of activity. This will be important in assessing how housing demand is holding up amid elevated rates and affordability pressures.

Thursday is the busiest day, with GDP (second estimate) and Personal Consumption Expenditures (PCE) inflation both released. The initial GDP reading showed softer growth, so this update will help confirm whether that weakness persists or stabilizes. At the same time, PCE will provide an updated read on inflation trends, which remain central to the Fed’s policy outlook.

Friday includes the Chicago PMI, which previously reflected modest business activity conditions. This release will serve as a timely check on manufacturing momentum and broader economic activity.

Meanwhile, crude oil inventories, which recently posted a sizable draw, will remain important for gauging supply-demand dynamics and their implications for energy prices and inflation.

Overall, these releases will help refine the market’s view on growth durability and inflation persistence, both of which remain key drivers of the rate outlook.

Economic Indicators:

  1. CPI: Consumer Price Index measures the average change in prices paid by consumers for goods and services over time. Source: Bureau of Labor Statistics.
  2. Core CPI: Core Consumer Price Index excludes food and energy prices to provide a clearer picture of long-term inflation trends. Source: Bureau of Labor Statistics.
  3. PPI: Producer Price Index measures the average change in selling prices received by domestic producers for their output. Source: Bureau of Labor Statistics.
  4. Core PPI: Core Producer Price Index excludes food and energy prices to provide a clearer picture of long-term inflation trends. Source: Bureau of Labor Statistics.
  5. PCE: Personal Consumption Expenditures measure the average change in prices paid by consumers for goods and services. Source: Bureau of Economic Analysis.
  6. Core PCE: Core Personal Consumption Expenditures exclude food and energy prices to provide a clearer picture of long-term inflation trends. Source: Bureau of Economic Analysis.
  7. Industrial Production: Measures the output of the industrial sector, including manufacturing, mining, and utilities. Source: Federal Reserve.
  8. Mfg New Orders: Measures the value of new orders placed with manufacturers for durable and non-durable goods. Source: Census Bureau.
  9. Durable New Orders: Measures the value of new orders placed with manufacturers of durable goods. Source: Census Bureau.
  10. Durable Inventories: Measures the value of inventories held by manufacturers for durable goods. Source: Census Bureau.
  11. Consumer Confidence (CB, 1985=100): Measures the degree of optimism that consumers feel about the overall state of the economy and their personal financial situation. Source: Conference Board.
  12. ISM Manufacturing Report: Measures the economic health of the manufacturing sector based on surveys of purchasing managers. Source: Institute for Supply Management.
  13. ISM Non-Manufacturing Report: Measures the economic health of the non-manufacturing sector based on surveys of purchasing managers. Source: Institute for Supply Management.
  14. Leading Economic Index: Measures overall economic activity and predicts future economic trends. Source: Conference Board.
  15. Building Permits (Mil. of Units, saar): Measures the number of new residential building permits issued. Source: Census Bureau.
  16. Housing Starts (Mil. of Units, saar): Measures the number of new residential construction projects that have begun. Source: Census Bureau.
  17. New Home Sales (Mil. of Units, saar): Measures the number of newly constructed homes sold. Source: Census Bureau.
  18. SA: Seasonally adjusted.
  19. SAAR: Seasonally adjusted annual rate.

Market Indices & Indicators:

  1. S&P 500: A market-capitalization-weighted index of 500 leading publicly traded companies in the U.S., widely regarded as one of the best gauges of large U.S. stocks and the stock market overall.
  2. Dow Jones 30: Also known as the Dow Jones Industrial Average, it tracks the share price performance of 30 large, publicly traded U.S. companies, serving as a barometer of the stock market and economy.
  3. NASDAQ: The world’s first electronic stock exchange, primarily listing technology giants and operating 29 markets globally.
  4. Russell 1000 Growth: Measures the performance of large-cap growth segment of the U.S. equity universe, including companies with higher price-to-book ratios and growth metrics.
  5. Russell 1000 Value: Measures the performance of large-cap value segment of the U.S. equity universe, including companies with lower price-to-book ratios and growth metrics.
  6. Russell 2000: A market index composed of 2,000 small-cap companies, widely used as a benchmark for small-cap mutual funds.
  7. Wilshire 5000: A market-capitalization-weighted index capturing the performance of all American stocks actively traded in the U.S., representing the broadest measure of the U.S. stock market.
  8. MSCI EAFE Index: An equity index capturing large and mid-cap representation across developed markets countries around the world, excluding the U.S. and Canada.
  9. MSCI Emerging Market Index: Captures large and mid-cap representation across emerging markets countries, covering approximately 85% of the free float-adjusted market capitalization in each country.
  10. VIX: The CBOE Volatility Index measures the market’s expectations for volatility over the coming 30 days, often referred to as the “fear gauge.”
  11. FTSE NAREIT All Equity REITs: Measures the performance of all publicly traded equity real estate investment trusts (REITs) listed in the U.S., excluding mortgage REITs.
  12. S&P U.S. Aggregate Bond Index: Represents the performance of the U.S. investment-grade bond market, including government, corporate, mortgage-backed, and asset-backed securities.
  13. 3-Month T-bill Yield (%): The yield on U.S. Treasury bills with a maturity of three months, reflecting short-term interest rates.
  14. 10-Year Treasury Yield (%): The yield on U.S. Treasury bonds with a maturity of ten years, reflecting long-term interest rates.
  15. 10Y-2Y Treasury Spread (%): The difference between the yields on 10-year and 2-year U.S. Treasury bonds, often used as an indicator of economic expectations.
  16. WTI Crude ($/bl): The price per barrel of West Texas Intermediate crude oil, a benchmark for U.S. oil prices.
  17. Gold ($/Troy Oz): The price per troy ounce of gold, a standard measure for gold prices.
  18. Bitcoin: A decentralized digital currency without a central bank or single administrator, which can be sent from user to user on the peer-to-peer bitcoin network.

This content was developed by Cambridge from sources believed to be reliable. This content is provided for informational purposes only and should not be construed or acted upon as individualized investment advice. It should not be considered a recommendation or solicitation. Information is subject to change. Any forward-looking statements are based on assumptions, may not materialize, and are subject to revision without notice. The information in this material is not intended as tax or legal advice.

Investing involves risk. Depending on the different types of investments there may be varying degrees of risk. Socially responsible investing does not guarantee any amount of success. Clients and prospective clients should be prepared to bear investment loss including loss of original principal. Indices mentioned are unmanaged and cannot be invested into directly. Past performance is not a guarantee of future results.

The Dow Jones Industrial Average (DJIA) is a price-weighted index composed of 30 widely traded blue-chip U.S. common stocks. The S&P 500 is a market-cap weighted index composed of the common stocks of 500 leading companies in leading industries of the U.S. economy. The NASDAQ Composite Index is a market-value weighted index of all common stocks listed on the NASDAQ stock exchange.

Securities offered through Cambridge Investment Research, Inc., a broker-dealer, member FINRA/SIPC, and investment advisory services offered through Cambridge Investment Research Advisors, Inc., a Registered Investment Adviser. Both are wholly-owned subsidiaries of Cambridge Investment Group, Inc. V.CIR.0526-1929.

Market Commentary | May 18th, 2026

Market Commentary | May 18th, 2026

Weekly Market Commentary

May 18th, 2026

Week in Review

Last week was centered on inflation and consumer demand, with housing and labor data helping round out the broader economic picture.

Inflation data leaned to the upside overall, particularly at the core and producer levels. Core Consumer Price Index (CPI) rose 0.4% month-over-month in April, above expectations of 0.3% and accelerating from the prior 0.2%, indicating underlying inflation remains sticky. Headline CPI increased 0.6%, in line with expectations but below the prior 0.9%, while year-over-year CPI rose to 3.8% versus 3.7% expected. Progress toward the Fed’s target continues, though at an uneven pace. More notably, the Producer Price Index (PPI) surprised significantly to the upside at 1.4% month-over-month versus a 0.5% forecast, pointing to building upstream cost pressures that could feed into future consumer prices.

Consumer demand remained resilient but showed signs of normalization. Retail sales rose 0.5% month-over-month, matching expectations but slowing from the prior 1.6%, while core retail sales increased 0.7%, also in line but well below the prior 1.9%. The data suggest consumers are still spending, though momentum has moderated from earlier strength.

Elsewhere, labor and housing data pointed to stability with some modest softening at the margins. Initial jobless claims came in at 211,000 versus 205,000 expected, ticking up from 199,000 previously but still within a stable range. Existing home sales registered at 4.02 million, slightly below expectations (4.05 million) and slightly above the prior 4.01 million, indicating a housing market that remains constrained yet steady.

Finally, rates and energy dynamics continued to reflect supply-side pressures. Treasury auctions cleared at higher yields, with the 10-year at 4.468% and the 30-year at 5.046%, while crude inventories declined by 4.3 million barrels, reinforcing tightening supply conditions and supporting near-term energy price pressures.

Economic and Capital Markets Dashboard

Week Ahead…

The upcoming week will shift focus toward early reads on May activity, labor conditions, and Fed communication, offering incremental clarity on whether growth remains resilient while policy expectations continue to evolve. Recent data has pointed to a mixed backdrop, with manufacturing showing relative strength while services activity remains modest, leaving markets focused on confirming whether growth is gradually cooling but still positive overall.

The week picks up on Wednesday with crude oil inventories, which will be closely watched following last week’s roughly 4.3-million-barrel draw. Continued tightening would reinforce supply-side pressures and could contribute to sustained firmness in energy prices. Later in the day, the release of the Federal Open Market Committee (FOMC) meeting minutes will provide additional insight into how policymakers are interpreting recent inflation data and balancing risks to growth. This should help refine expectations around the Fed’s policy path, particularly whether a higher-for-longer stance remains intact.

Attention then turns to Thursday, where the data flow broadens across labor, regional manufacturing, and forward-looking activity indicators. Initial jobless claims are expected near 210,000, a slight improvement from the prior 211,000 reading, and will serve as a timely gauge of labor market conditions. At the same time, the Philadelphia Fed Manufacturing Index is expected to decline to 17.9 from 26.7, pointing to some moderation while still indicating expansion. Preliminary Purchasing Managers’ Index (PMI) data will then provide an early look at May momentum, with manufacturing easing slightly and services holding near modest expansion levels, helping determine whether growth remains intact but gradually cooling.

Economic Indicators:

  1. CPI: Consumer Price Index measures the average change in prices paid by consumers for goods and services over time. Source: Bureau of Labor Statistics.
  2. Core CPI: Core Consumer Price Index excludes food and energy prices to provide a clearer picture of long-term inflation trends. Source: Bureau of Labor Statistics.
  3. PPI: Producer Price Index measures the average change in selling prices received by domestic producers for their output. Source: Bureau of Labor Statistics.
  4. Core PPI: Core Producer Price Index excludes food and energy prices to provide a clearer picture of long-term inflation trends. Source: Bureau of Labor Statistics.
  5. PCE: Personal Consumption Expenditures measure the average change in prices paid by consumers for goods and services. Source: Bureau of Economic Analysis.
  6. Core PCE: Core Personal Consumption Expenditures exclude food and energy prices to provide a clearer picture of long-term inflation trends. Source: Bureau of Economic Analysis.
  7. Industrial Production: Measures the output of the industrial sector, including manufacturing, mining, and utilities. Source: Federal Reserve.
  8. Mfg New Orders: Measures the value of new orders placed with manufacturers for durable and non-durable goods. Source: Census Bureau.
  9. Durable New Orders: Measures the value of new orders placed with manufacturers of durable goods. Source: Census Bureau.
  10. Durable Inventories: Measures the value of inventories held by manufacturers for durable goods. Source: Census Bureau.
  11. Consumer Confidence (CB, 1985=100): Measures the degree of optimism that consumers feel about the overall state of the economy and their personal financial situation. Source: Conference Board.
  12. ISM Manufacturing Report: Measures the economic health of the manufacturing sector based on surveys of purchasing managers. Source: Institute for Supply Management.
  13. ISM Non-Manufacturing Report: Measures the economic health of the non-manufacturing sector based on surveys of purchasing managers. Source: Institute for Supply Management.
  14. Leading Economic Index: Measures overall economic activity and predicts future economic trends. Source: Conference Board.
  15. Building Permits (Mil. of Units, saar): Measures the number of new residential building permits issued. Source: Census Bureau.
  16. Housing Starts (Mil. of Units, saar): Measures the number of new residential construction projects that have begun. Source: Census Bureau.
  17. New Home Sales (Mil. of Units, saar): Measures the number of newly constructed homes sold. Source: Census Bureau.
  18. SA: Seasonally adjusted.
  19. SAAR: Seasonally adjusted annual rate.

Market Indices & Indicators:

  1. S&P 500: A market-capitalization-weighted index of 500 leading publicly traded companies in the U.S., widely regarded as one of the best gauges of large U.S. stocks and the stock market overall.
  2. Dow Jones 30: Also known as the Dow Jones Industrial Average, it tracks the share price performance of 30 large, publicly traded U.S. companies, serving as a barometer of the stock market and economy.
  3. NASDAQ: The world’s first electronic stock exchange, primarily listing technology giants and operating 29 markets globally.
  4. Russell 1000 Growth: Measures the performance of large-cap growth segment of the U.S. equity universe, including companies with higher price-to-book ratios and growth metrics.
  5. Russell 1000 Value: Measures the performance of large-cap value segment of the U.S. equity universe, including companies with lower price-to-book ratios and growth metrics.
  6. Russell 2000: A market index composed of 2,000 small-cap companies, widely used as a benchmark for small-cap mutual funds.
  7. Wilshire 5000: A market-capitalization-weighted index capturing the performance of all American stocks actively traded in the U.S., representing the broadest measure of the U.S. stock market.
  8. MSCI EAFE Index: An equity index capturing large and mid-cap representation across developed markets countries around the world, excluding the U.S. and Canada.
  9. MSCI Emerging Market Index: Captures large and mid-cap representation across emerging markets countries, covering approximately 85% of the free float-adjusted market capitalization in each country.
  10. VIX: The CBOE Volatility Index measures the market’s expectations for volatility over the coming 30 days, often referred to as the “fear gauge.”
  11. FTSE NAREIT All Equity REITs: Measures the performance of all publicly traded equity real estate investment trusts (REITs) listed in the U.S., excluding mortgage REITs.
  12. S&P U.S. Aggregate Bond Index: Represents the performance of the U.S. investment-grade bond market, including government, corporate, mortgage-backed, and asset-backed securities.
  13. 3-Month T-bill Yield (%): The yield on U.S. Treasury bills with a maturity of three months, reflecting short-term interest rates.
  14. 10-Year Treasury Yield (%): The yield on U.S. Treasury bonds with a maturity of ten years, reflecting long-term interest rates.
  15. 10Y-2Y Treasury Spread (%): The difference between the yields on 10-year and 2-year U.S. Treasury bonds, often used as an indicator of economic expectations.
  16. WTI Crude ($/bl): The price per barrel of West Texas Intermediate crude oil, a benchmark for U.S. oil prices.
  17. Gold ($/Troy Oz): The price per troy ounce of gold, a standard measure for gold prices.
  18. Bitcoin: A decentralized digital currency without a central bank or single administrator, which can be sent from user to user on the peer-to-peer bitcoin network.

This content was developed by Cambridge from sources believed to be reliable. This content is provided for informational purposes only and should not be construed or acted upon as individualized investment advice. It should not be considered a recommendation or solicitation. Information is subject to change. Any forward-looking statements are based on assumptions, may not materialize, and are subject to revision without notice. The information in this material is not intended as tax or legal advice.

Investing involves risk. Depending on the different types of investments there may be varying degrees of risk. Socially responsible investing does not guarantee any amount of success. Clients and prospective clients should be prepared to bear investment loss including loss of original principal. Indices mentioned are unmanaged and cannot be invested into directly. Past performance is not a guarantee of future results.

The Dow Jones Industrial Average (DJIA) is a price-weighted index composed of 30 widely traded blue-chip U.S. common stocks. The S&P 500 is a market-cap weighted index composed of the common stocks of 500 leading companies in leading industries of the U.S. economy. The NASDAQ Composite Index is a market-value weighted index of all common stocks listed on the NASDAQ stock exchange.

Securities offered through Cambridge Investment Research, Inc., a broker-dealer, member FINRA/SIPC, and investment advisory services offered through Cambridge Investment Research Advisors, Inc., a Registered Investment Adviser. Both are wholly-owned subsidiaries of Cambridge Investment Group, Inc. V.CIR.0526-1825