
Weekly Market Commentary
January 20th, 2026
Week in Review…
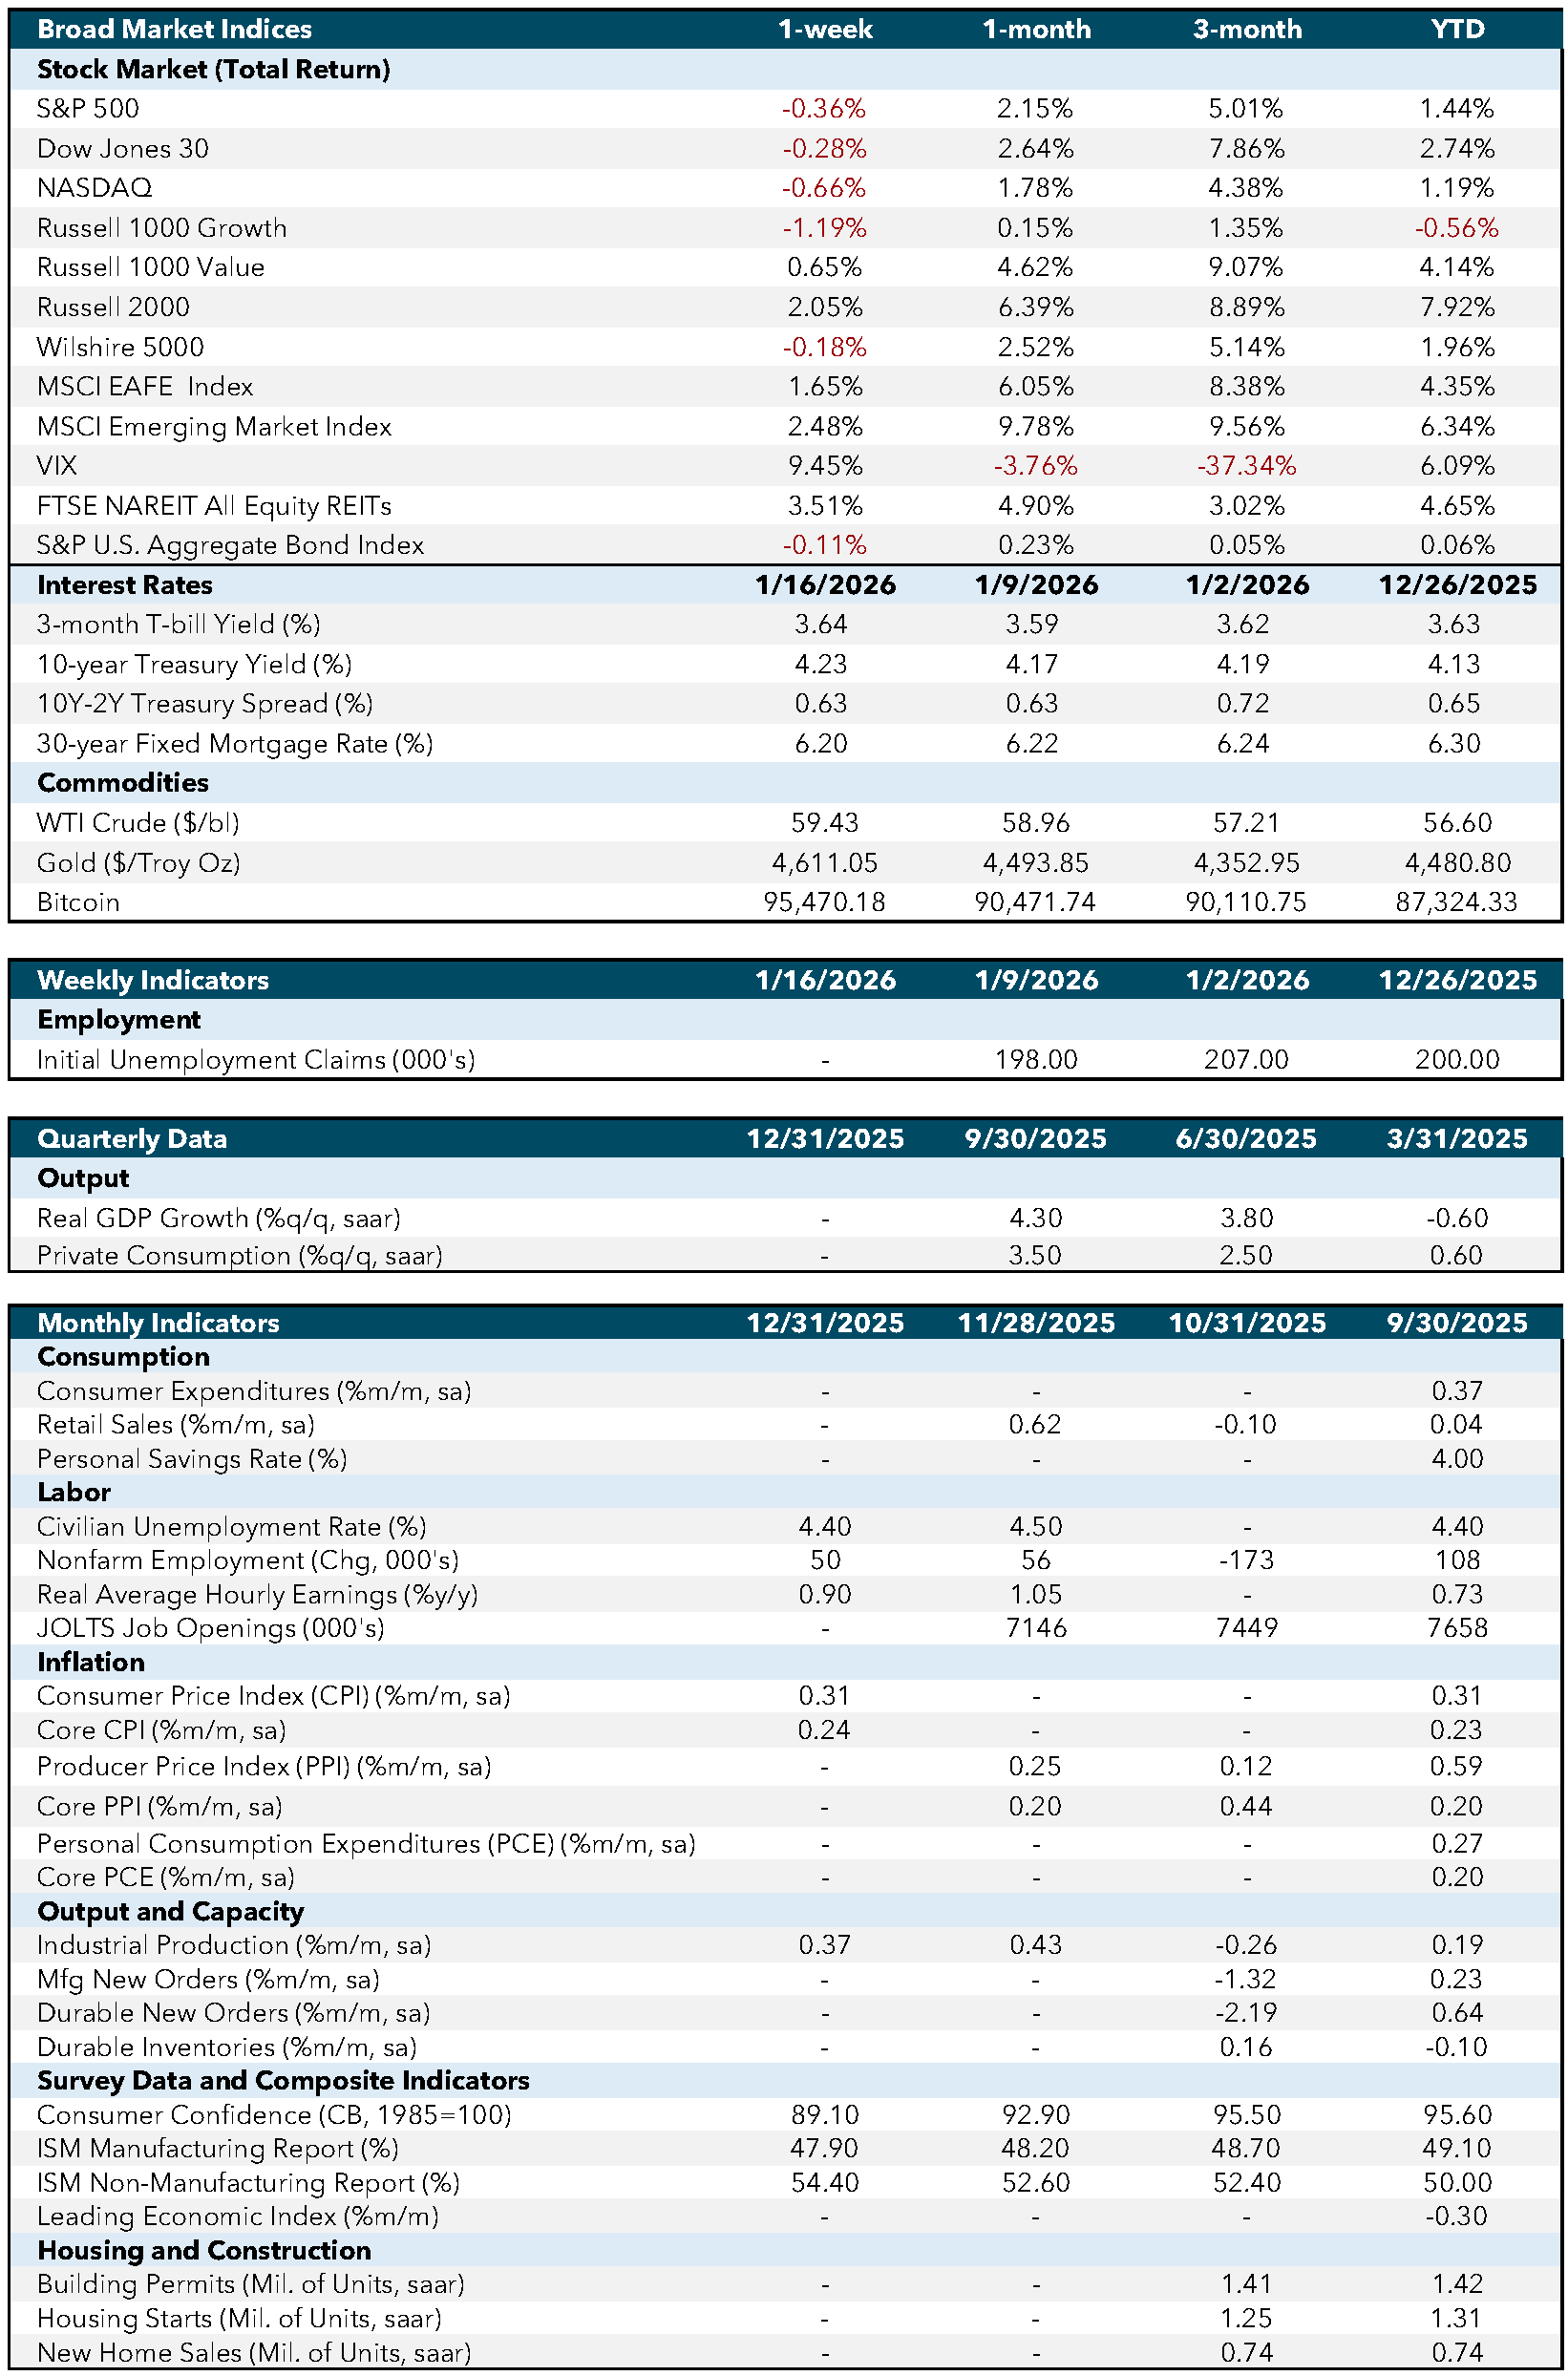
Markets spent the week sifting through economic data still distorted by the lingering effects of last year’s federal shutdown. The Consumer Price Index (CPI) remains clouded by the Bureau of Labor Statistics’ decision to carry forward September pricing data into October, effectively creating a “zero” print that understated inflation at the time and inflated readings in November and December as missing prices were finally captured. This has split market participants: some see evidence that tariff-related price pressures were milder than feared, while others argue the recent 0.2% CPI rise remains artificially depressed by residual shutdown imputation effects.
Margins Under Pressure
The Producer Price Index (PPI) offers a cleaner read. Unlike CPI, much of the data was retroactively collected, and the sharp 0.3% October jump likely reflects firms front‑loading price increases in anticipation of supply disruptions. Paired with this week’s CPI report, the data suggest a rebalancing of margins. The Fed’s Beige Book corroborates this dynamic, noting input costs up 5-7% while selling prices rose only about 3%, with retailers and restaurants reluctant to pass costs to increasingly price‑sensitive consumers.
Efficiency, Not Expansion
Labor conditions echo this margin pressure. Firms appear to be in a “no hiring, no firing” posture, hoarding skilled labor but slowing net additions. The New York Empire State and Philadelphia Fed surveys reinforced this dynamic, with stronger orders and shipments but softer employment metrics. Friday’s Industrial Production report beat expectations (0.4% versus 0.1%), and capacity utilization climbed to 76.3%. Together, the data suggest firms are defending margins by squeezing more output from existing labor and capital, funding higher input costs through restrained hiring, slower wage growth, and efficiency gains. This approach lets companies maintain production without raising prices and risking pushback from cost‑sensitive consumers.
A Cautious but Resilient Consumer
The consumer, however, looks more resilient than headlines suggest. November retail sales rose 0.6%, and existing home sales surprised to the upside, increasing 5.1% month-over-month, suggesting households view today’s stable labor market as sufficient footing for taking on large purchases. These reports point to a cautious but confident retail consumer, willing to spend selectively even amid cost pressures.
Economic and Capital Markets Dashboard
Week Ahead…

The coming week marks a key transition for markets as attention shifts from regional manufacturing snapshots to broader national signals.
The Inflation and Consumption Crucible
The headline event is Thursday’s Personal Consumption Expenditures (PCE) report. As the Fed’s preferred inflation gauge, markets will watch closely to see whether it echoes last week’s muted CPI reading. Because PCE is chain‑weighted, the report will also clarify the “substitution effect”: whether consumers are simply trading down (“steak to chicken”) to manage higher prices, or if inflation has broadened enough that even the cheaper options are rising in cost. A hotter‑than‑expected print would likely undermine expectations for mid‑year rate cuts.
Complementing this, the Personal Spending report will help clarify the underlying health of consumption. After a surprisingly strong retail sales print, this data will reveal whether spending momentum is broad‑based or if a bifurcated economy is being supported primarily by upper‑income households.
Housing and Sentiment
Wednesday’s Pending Home Sales will help determine whether the recent surge in New Home Sales was a one‑off or a sign of sustained improvement. Markets will be watching to see if demand remains in the pipeline or if lower mortgage rates simply cleared out stale inventory.
The week concludes with S&P Global PMIs and the University of Michigan Consumer Sentiment Index. Following expansionary signals from the Philadelphia and New York Fed surveys, these reports will test whether rising industrial activity, paired with more cautious, efficiency‑focused hiring, is scaling into a national trend.
On the Radar:
- 10‑yr TIPS Auction: Offers a market‑based read on 10‑year breakeven inflation expectations, an important check against sentiment‑based surveys.
- IEA Monthly Report: Particularly relevant after recent Fed anecdotes highlighted rising energy and gasoline input costs, making producer margins sensitive to global supply dynamics.
Economic Indicators:
- CPI: Consumer Price Index measures the average change in prices paid by consumers for goods and services over time. Source: Bureau of Labor Statistics.
- Core CPI: Core Consumer Price Index excludes food and energy prices to provide a clearer picture of long-term inflation trends. Source: Bureau of Labor Statistics.
- PPI: Producer Price Index measures the average change in selling prices received by domestic producers for their output. Source: Bureau of Labor Statistics.
- Core PPI: Core Producer Price Index excludes food and energy prices to provide a clearer picture of long-term inflation trends. Source: Bureau of Labor Statistics.
- PCE: Personal Consumption Expenditures measure the average change in prices paid by consumers for goods and services. Source: Bureau of Economic Analysis.
- Core PCE: Core Personal Consumption Expenditures exclude food and energy prices to provide a clearer picture of long-term inflation trends. Source: Bureau of Economic Analysis.
- Industrial Production: Measures the output of the industrial sector, including manufacturing, mining, and utilities. Source: Federal Reserve.
- Mfg New Orders: Measures the value of new orders placed with manufacturers for durable and non-durable goods. Source: Census Bureau.
- Durable New Orders: Measures the value of new orders placed with manufacturers of durable goods. Source: Census Bureau.
- Durable Inventories: Measures the value of inventories held by manufacturers for durable goods. Source: Census Bureau.
- Consumer Confidence (CB, 1985=100): Measures the degree of optimism that consumers feel about the overall state of the economy and their personal financial situation. Source: Conference Board.
- ISM Manufacturing Report: Measures the economic health of the manufacturing sector based on surveys of purchasing managers. Source: Institute for Supply Management.
- ISM Non-Manufacturing Report: Measures the economic health of the non-manufacturing sector based on surveys of purchasing managers. Source: Institute for Supply Management.
- Leading Economic Index: Measures overall economic activity and predicts future economic trends. Source: Conference Board.
- Building Permits (Mil. of Units, saar): Measures the number of new residential building permits issued. Source: Census Bureau.
- Housing Starts (Mil. of Units, saar): Measures the number of new residential construction projects that have begun. Source: Census Bureau.
- New Home Sales (Mil. of Units, saar): Measures the number of newly constructed homes sold. Source: Census Bureau.
- SA: Seasonally adjusted.
- SAAR: Seasonally adjusted annual rate.
Market Indices & Indicators:
- S&P 500: A market-capitalization-weighted index of 500 leading publicly traded companies in the U.S., widely regarded as one of the best gauges of large U.S. stocks and the stock market overall.
- Dow Jones 30: Also known as the Dow Jones Industrial Average, it tracks the share price performance of 30 large, publicly traded U.S. companies, serving as a barometer of the stock market and economy.
- NASDAQ: The world’s first electronic stock exchange, primarily listing technology giants and operating 29 markets globally.
- Russell 1000 Growth: Measures the performance of large-cap growth segment of the U.S. equity universe, including companies with higher price-to-book ratios and growth metrics.
- Russell 1000 Value: Measures the performance of large-cap value segment of the U.S. equity universe, including companies with lower price-to-book ratios and growth metrics.
- Russell 2000: A market index composed of 2,000 small-cap companies, widely used as a benchmark for small-cap mutual funds.
- Wilshire 5000: A market-capitalization-weighted index capturing the performance of all American stocks actively traded in the U.S., representing the broadest measure of the U.S. stock market.
- MSCI EAFE Index: An equity index capturing large and mid-cap representation across developed markets countries around the world, excluding the U.S. and Canada.
- MSCI Emerging Market Index: Captures large and mid-cap representation across emerging markets countries, covering approximately 85% of the free float-adjusted market capitalization in each country.
- VIX: The CBOE Volatility Index measures the market’s expectations for volatility over the coming 30 days, often referred to as the “fear gauge.”
- FTSE NAREIT All Equity REITs: Measures the performance of all publicly traded equity real estate investment trusts (REITs) listed in the U.S., excluding mortgage REITs.
- S&P U.S. Aggregate Bond Index: Represents the performance of the U.S. investment-grade bond market, including government, corporate, mortgage-backed, and asset-backed securities.
- 3-Month T-bill Yield (%): The yield on U.S. Treasury bills with a maturity of three months, reflecting short-term interest rates.
- 10-Year Treasury Yield (%): The yield on U.S. Treasury bonds with a maturity of ten years, reflecting long-term interest rates.
- 10Y-2Y Treasury Spread (%): The difference between the yields on 10-year and 2-year U.S. Treasury bonds, often used as an indicator of economic expectations.
- WTI Crude ($/bl): The price per barrel of West Texas Intermediate crude oil, a benchmark for U.S. oil prices.
- Gold ($/Troy Oz): The price per troy ounce of gold, a standard measure for gold prices.
- Bitcoin: A decentralized digital currency without a central bank or single administrator, which can be sent from user to user on the peer-to-peer bitcoin network.
This content was developed by Cambridge from sources believed to be reliable. This content is provided for informational purposes only and should not be construed or acted upon as individualized investment advice. It should not be considered a recommendation or solicitation. Information is subject to change. Any forward-looking statements are based on assumptions, may not materialize, and are subject to revision without notice. The information in this material is not intended as tax or legal advice.
Investing involves risk. Depending on the different types of investments there may be varying degrees of risk. Socially responsible investing does not guarantee any amount of success. Clients and prospective clients should be prepared to bear investment loss including loss of original principal. Indices mentioned are unmanaged and cannot be invested into directly. Past performance is not a guarantee of future results.
The Dow Jones Industrial Average (DJIA) is a price-weighted index composed of 30 widely traded blue-chip U.S. common stocks. The S&P 500 is a market-cap weighted index composed of the common stocks of 500 leading companies in leading industries of the U.S. economy. The NASDAQ Composite Index is a market-value weighted index of all common stocks listed on the NASDAQ stock exchange.
Securities offered through Cambridge Investment Research, Inc., a broker-dealer, member FINRA/SIPC, and investment advisory services offered through Cambridge Investment Research Advisors, Inc., a Registered Investment Adviser. Both are wholly-owned subsidiaries of Cambridge Investment Group, Inc. V.CIR.0126-